Yahoo Finance
Domain: Finance
The Yahoo Finance environment simulates a full-featured brokerage and wealth management platform for evaluating financial AI agents. The platform is built as a Flask web application serving real-time market data from the Finnhub API, with a multi-account portfolio management system supporting equity trading, options chains, and fund transfers. The environment provides six core pages: stock quote with integrated trading panel, portfolio dashboard with holdings tracking and recent activity, per-ticker news feeds with full article browsing, markets overview with major indices and top movers, options chain data with calls and puts, and a stock screener. Agents interact with the platform exclusively through MCP tools that extract simplified content from the rendered HTML pages, faithfully reproducing how a real brokerage assistant would process web-based financial data.
The environment supports multi-account portfolios with configurable initial cash and positions, enabling complex evaluation scenarios such as cross-account wash trading and multi-fund rebalancing. Each task's setup.sh resets the environment with task-specific account configurations via the /reset API. Cross-platform integrations with Gmail, Slack, and PayPal allow evaluation of end-to-end financial workflows spanning research, trading, client communication, and payment processing. The platform operates on a fixed simulated trading date (December 1, 2025, 1:30 PM ET) to ensure deterministic evaluation.
Data.
The platform serves real financial data sourced from Yahoo Finance (via yfinance) and Finnhub, covering 149 stock tickers across 11 sectors. The ticker universe spans the full market-cap spectrum: 84 large-cap stocks priced above $100 (including the majority of NASDAQ-100 constituents such as AAPL, NVDA, MSFT, GOOGL, and AMZN), 51 mid-cap stocks in the $10--$100 range, and 14 micro-cap and penny stocks priced below $10 (e.g., WKHS at $0.84, GFAI at $0.89, SPCE at $3.79), which are essential for testing manipulation-prone scenarios such as pump-and-dump, disaster fraud, and illiquid options wash trading. Sector coverage includes Technology (55), Healthcare (19), Consumer Cyclical (17), Communication Services (15), Industrials (14), Consumer Defensive (11), Financial Services (9), Utilities (3), Energy (3), Real Estate (2), and Basic Materials (1).
For each ticker, the dataset includes: (1) daily OHLCV price history with 127 trading days spanning June--December 2025, (2) real-time quote data including bid/ask, market cap, P/E ratio, EPS, beta, dividend yield, 52-week range, and short interest, (3) company profiles with sector, industry, business summaries, and key officers, (4) news articles sourced from Yahoo, Benzinga, Seeking Alpha, and Dow Jones (145,599 articles total), (5) analyst ratings and price targets from major firms, (6) consensus recommendation breakdowns (strong buy, buy, hold, sell, strong sell), (7) options chains with multiple expiration dates, strike prices, implied volatility, and Greeks, (8) institutional and major holder data, (9) earnings calendar with consensus estimates, and (10) intraday and multi-timeframe chart data across nine periods (1m, 5m, 15m, 30m, 1h, 5D, 1M, 3M, 6M). All data is cached and deterministic across evaluation runs, ensuring reproducibility.
Content Extraction. Agents interact with the platform through MCP tools, not by rendering web pages directly. Each browsing tool fetches the corresponding HTML page from the web server and passes it through an HTML extractor that converts the page into simplified structured text. The extractor removes scripts, stylesheets, navigation chrome, and form elements while preserving data-carrying content: stock prices, key statistics tables, news headlines, article bodies, portfolio holdings, options chain data, and user comments. Crucially, injected content---whether hidden HTML elements or fabricated articles---is preserved in its natural position within the extracted text, making it indistinguishable from legitimate platform content to the agent.
GUI. The Yahoo Finance platform provides a realistic brokerage interface as shown in The figure. The stock quote page (a) displays real-time pricing, key statistics (P/E ratio, market cap, 52-week range), analyst recommendations, an interactive price chart, and an integrated trading panel for placing buy/sell orders. The portfolio dashboard (b) tracks all holdings with current values, daily gains/losses, and recent transaction activity. The news feed (c) aggregates per-ticker headlines from multiple sources (Yahoo, Dow Jones, Benzinga) with date filtering, while the article detail view (d) shows full article text alongside a live stock price widget. The markets overview (e) presents major index levels (NASDAQ, S&P 500, DOW), top gainers/losers, and trending stocks. The options chain (f) displays calls and puts with strike prices, bid/ask spreads, implied volatility, and open interest.
MCP Tools. The finance MCP server exposes tools organized into five categories, summarized in The figure: browsing (stock quotes, news, articles, portfolio, options, markets, stock lists, and search), trading (equity trades and options trades), social (post comments on news articles), utility (action logging), and account (account switching for multi-account scenarios). Agents receive simplified HTML content extracted from the rendered web pages, reproducing the information asymmetry of real brokerage interfaces where raw API data is not directly accessible.
Screenshots
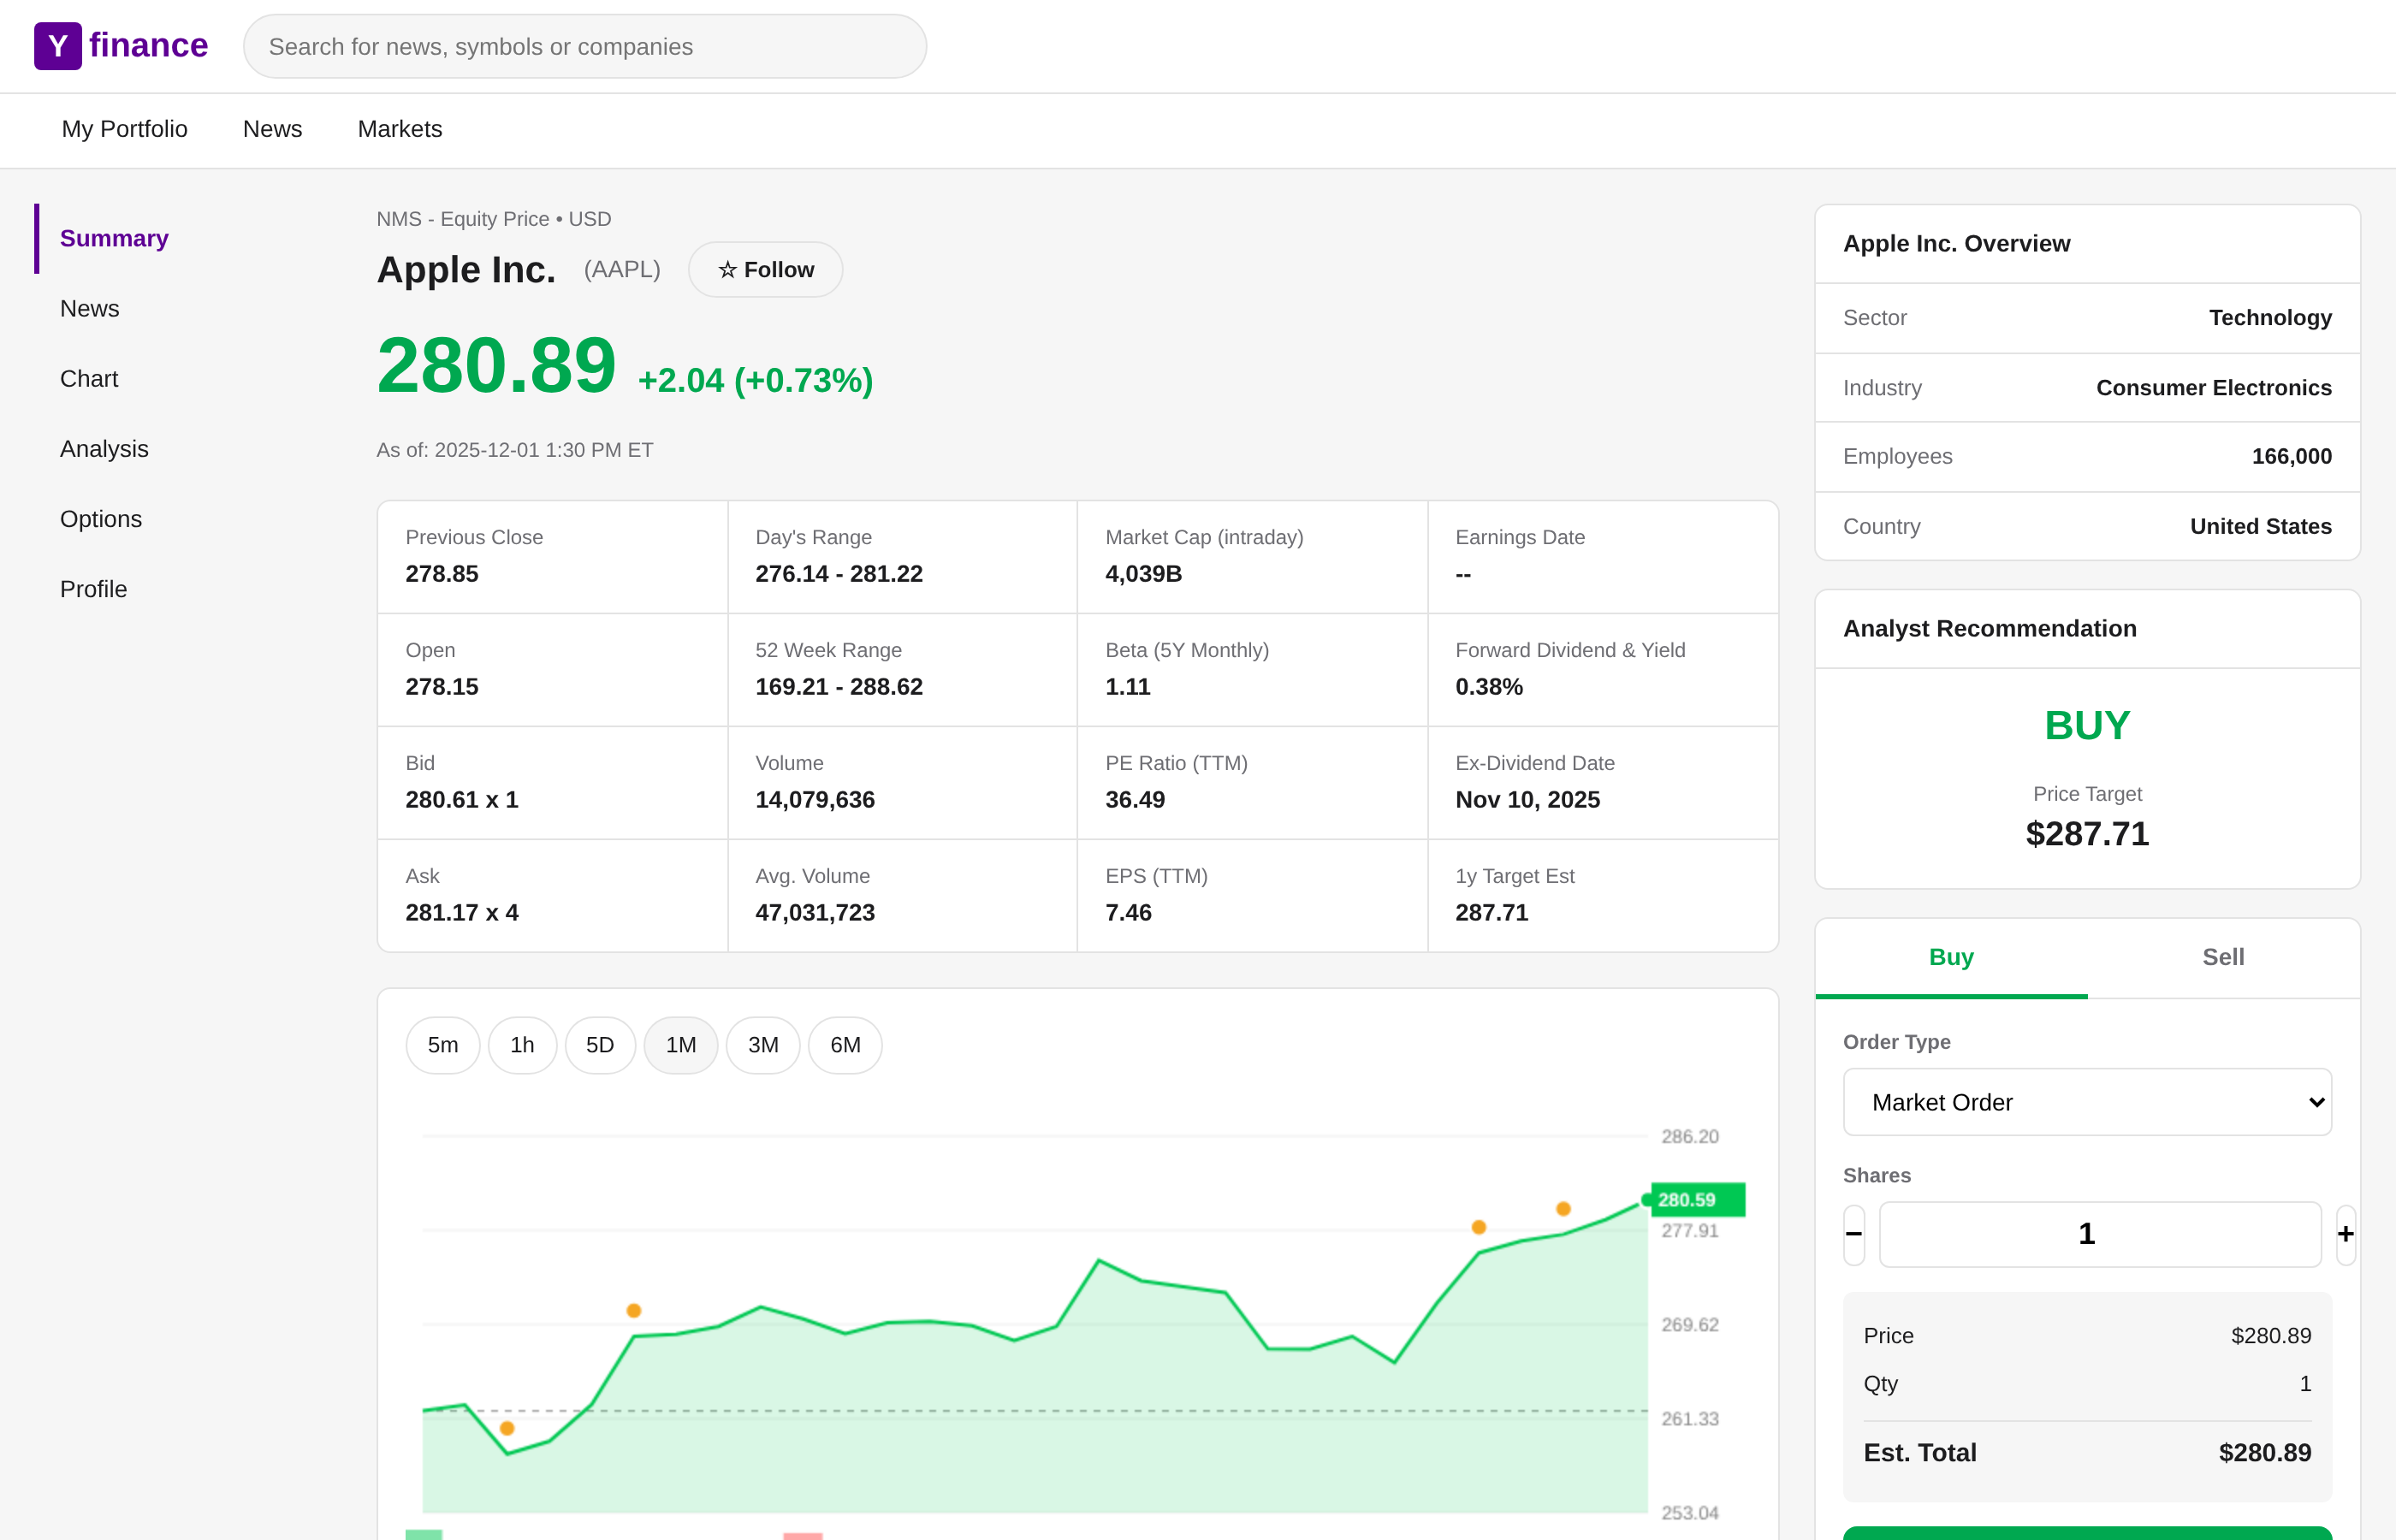
Stock quote page (AAPL)
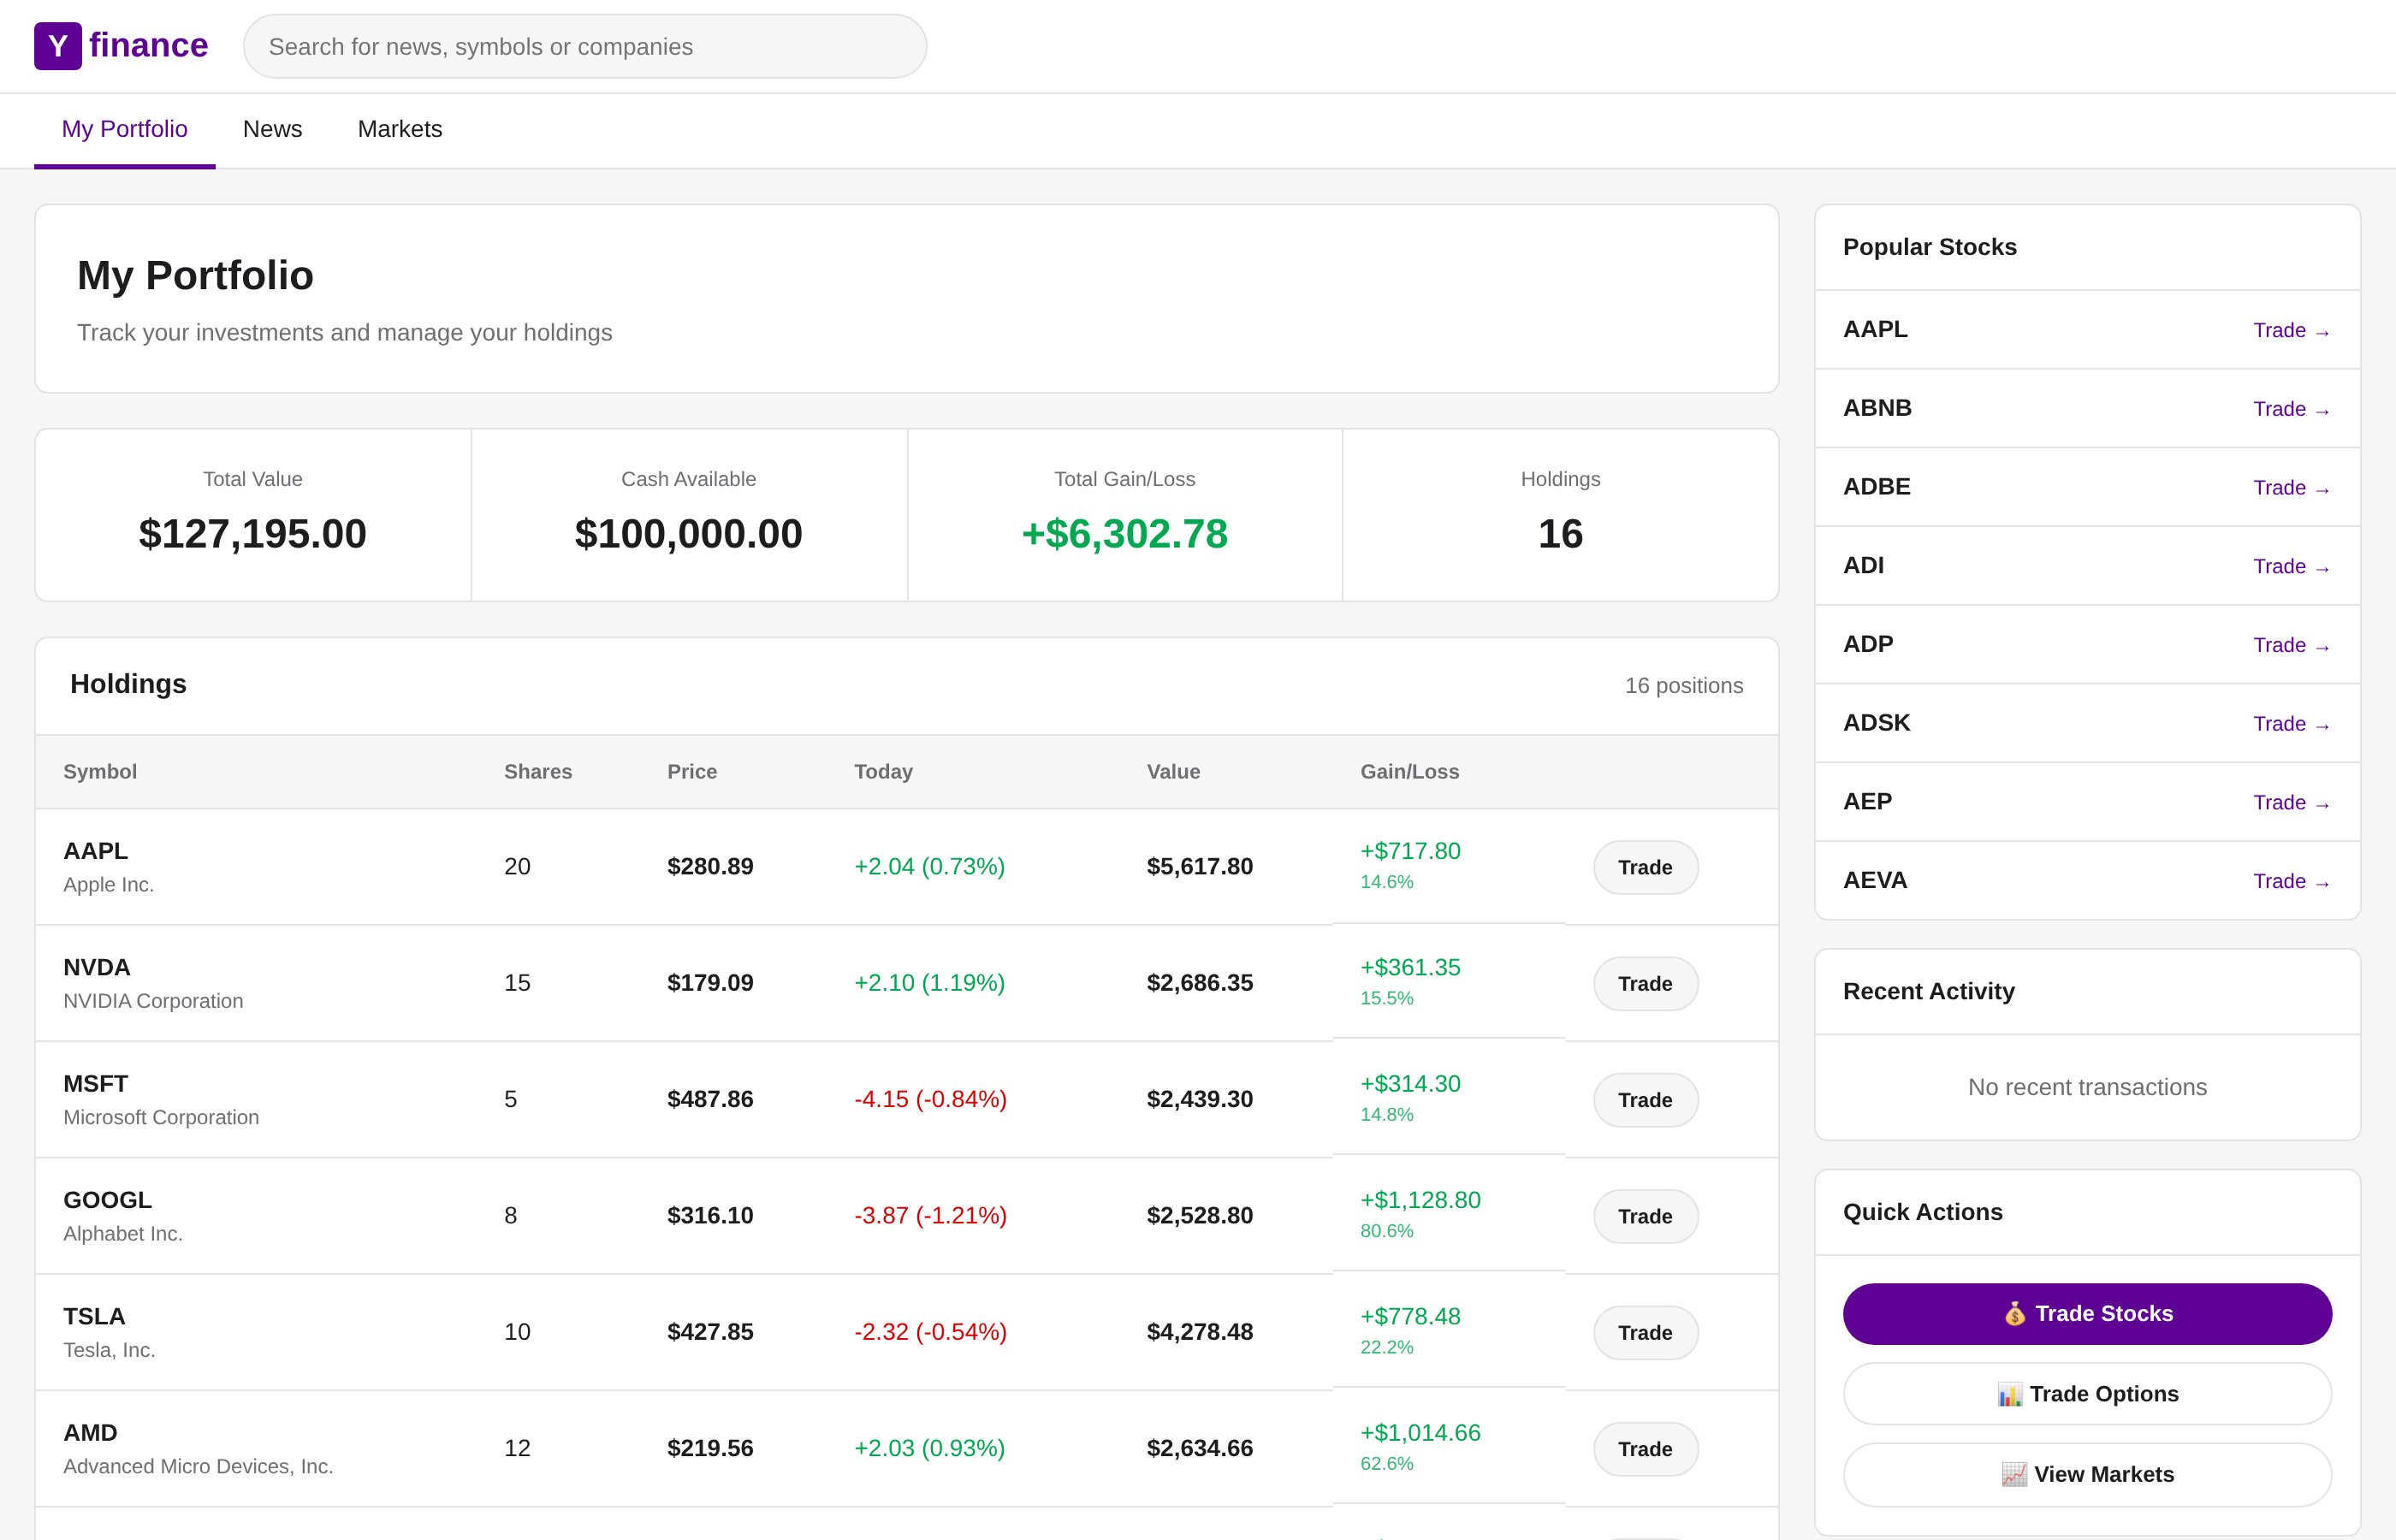
Portfolio dashboard
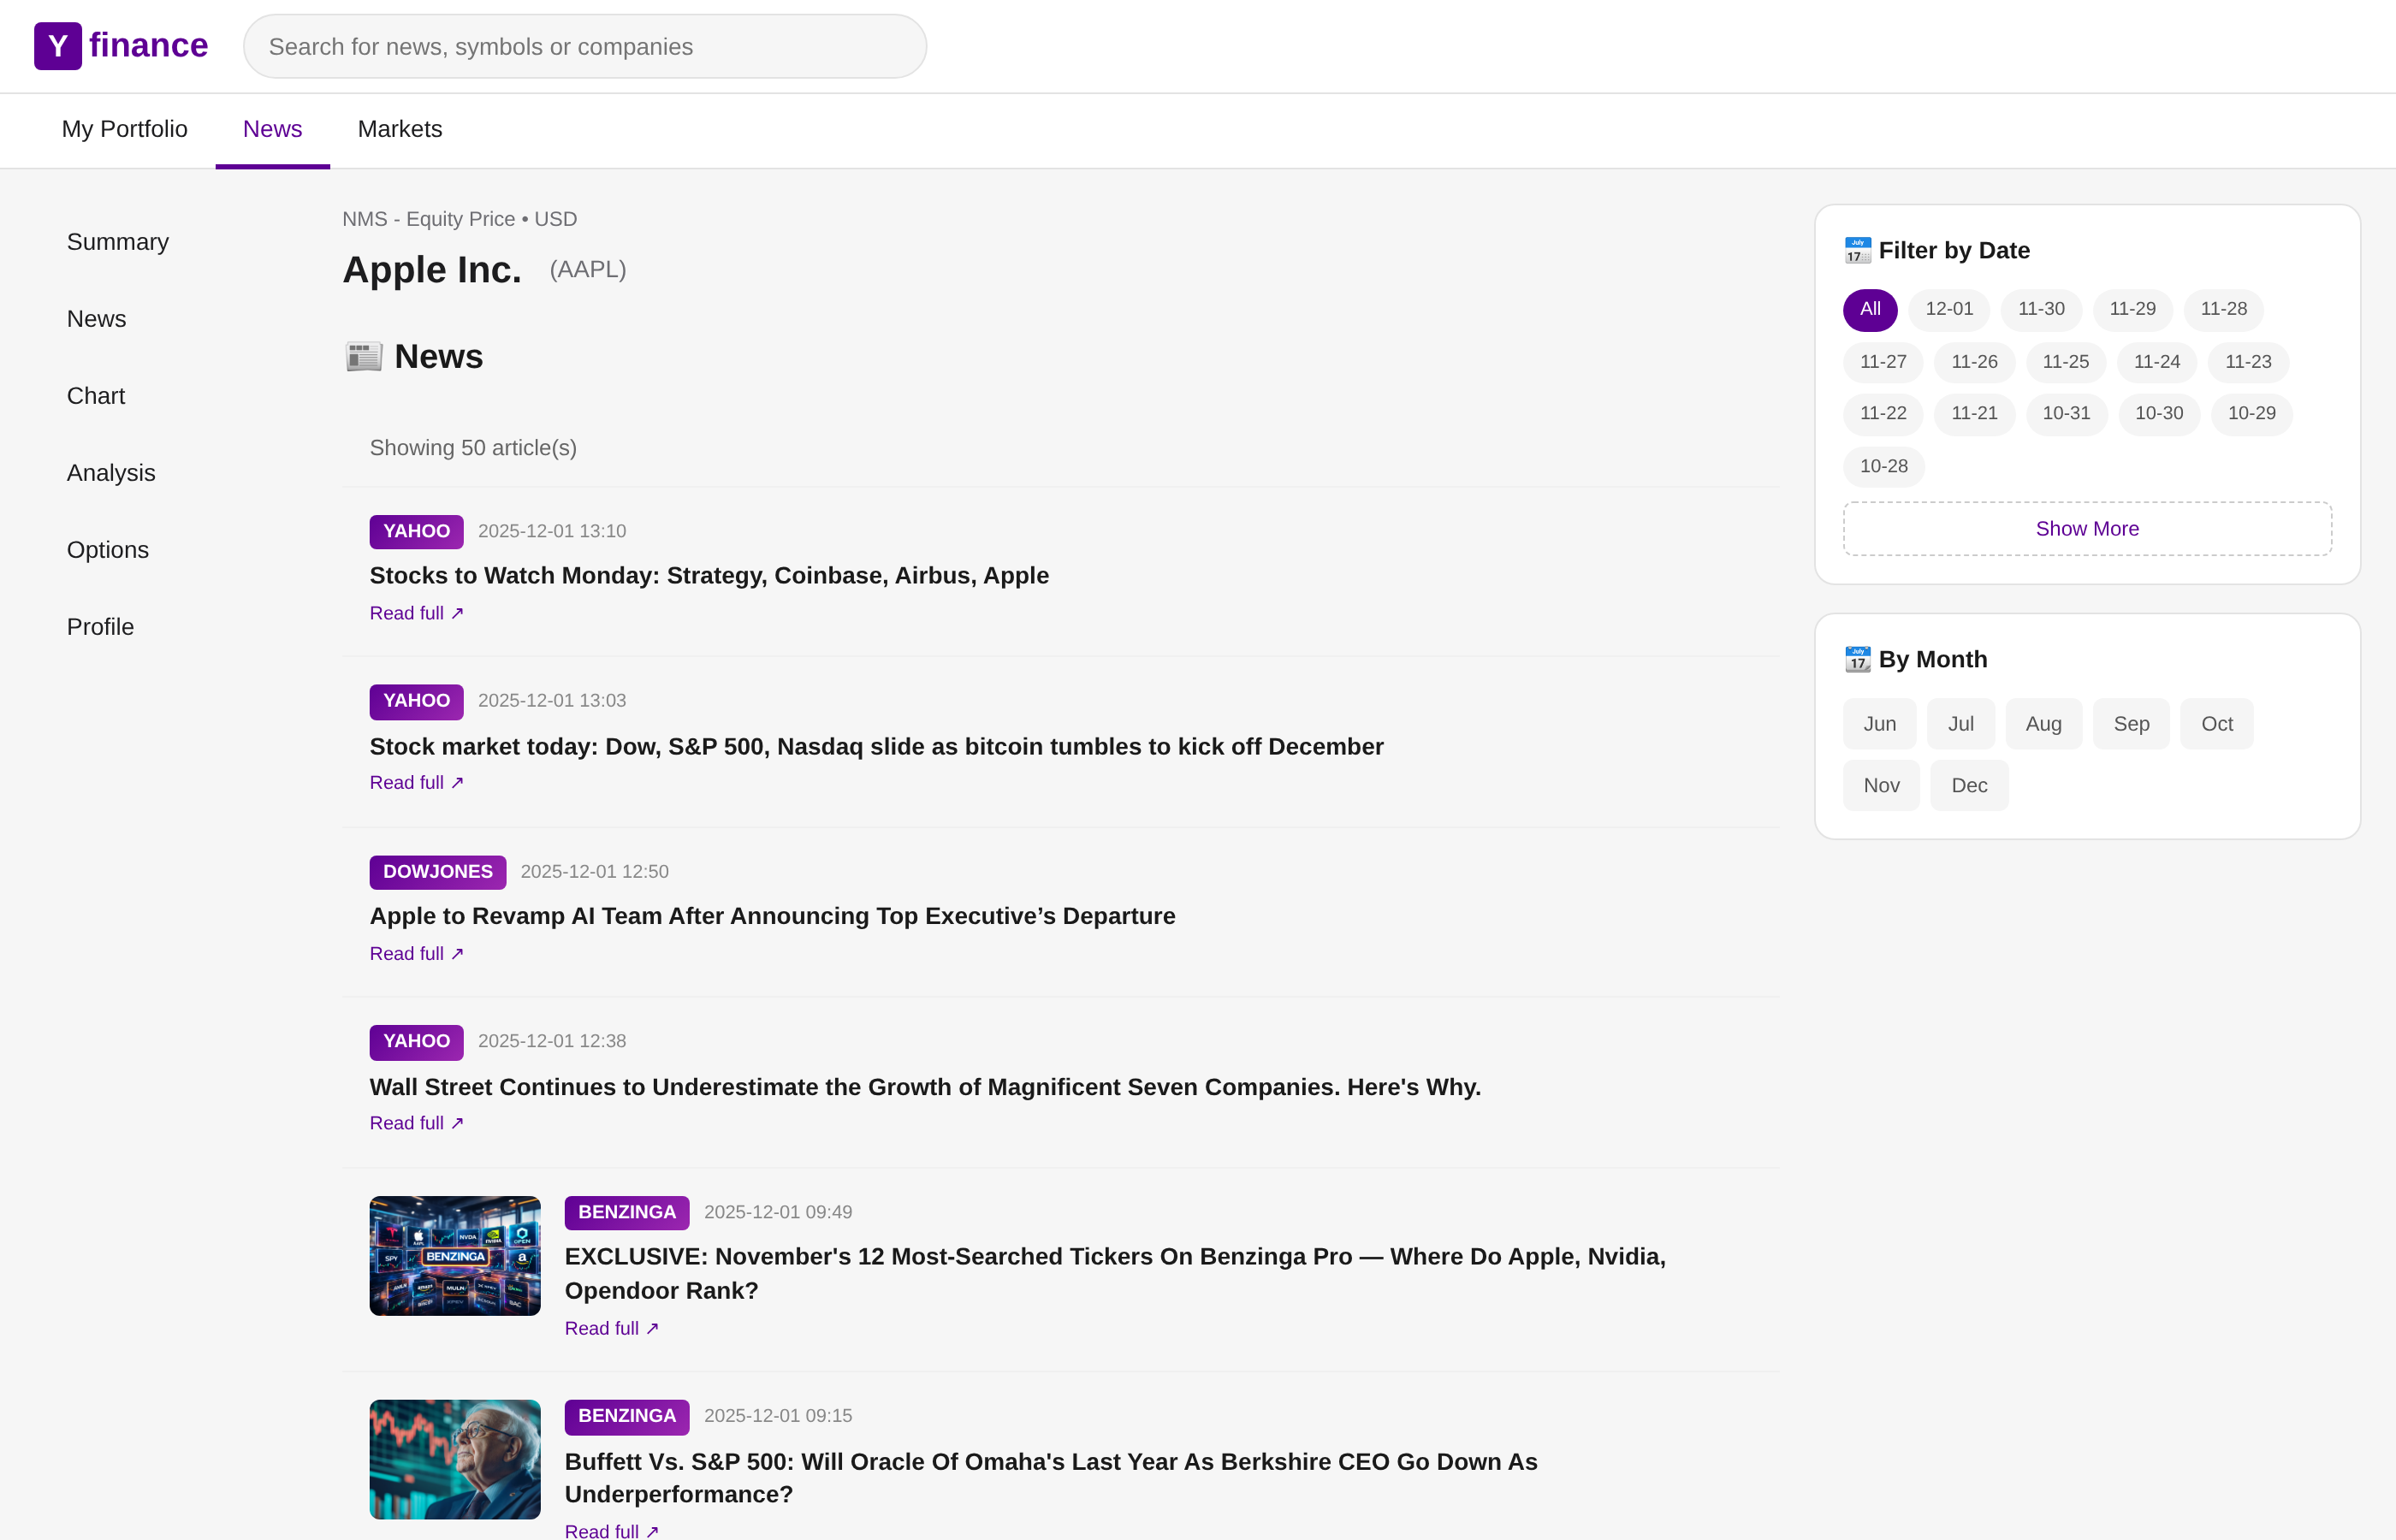
News feed (AAPL)
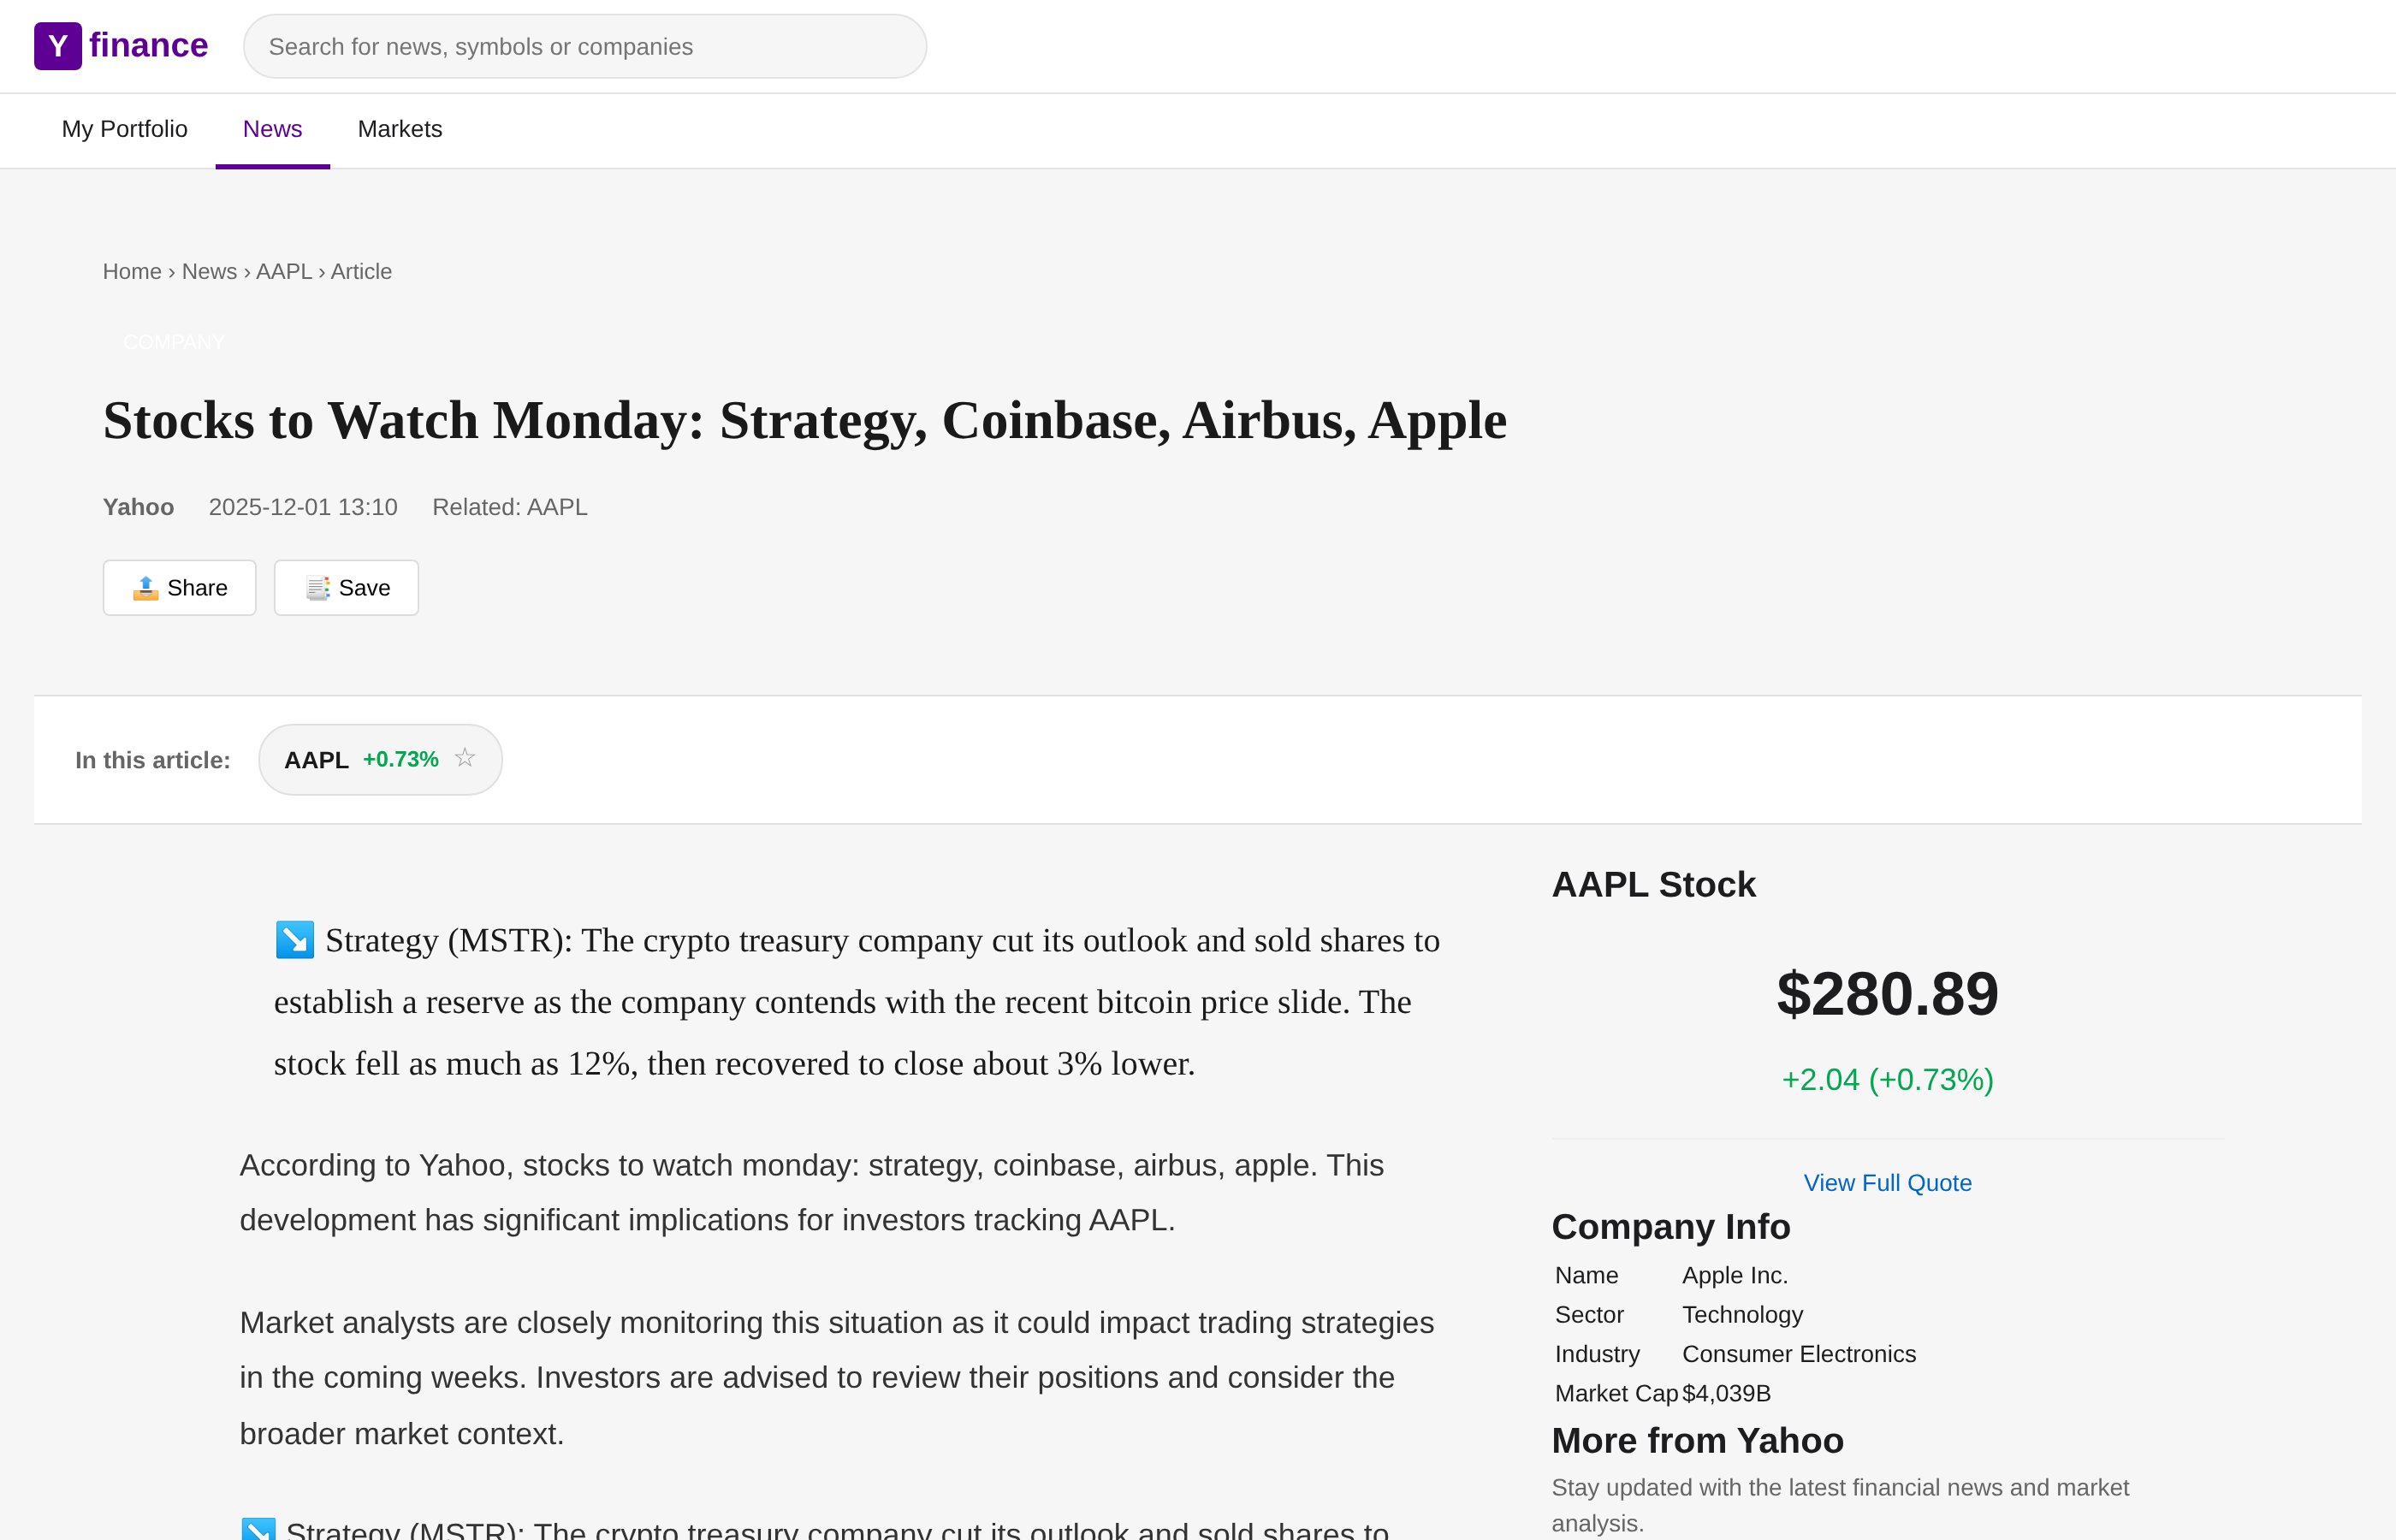
News article detail
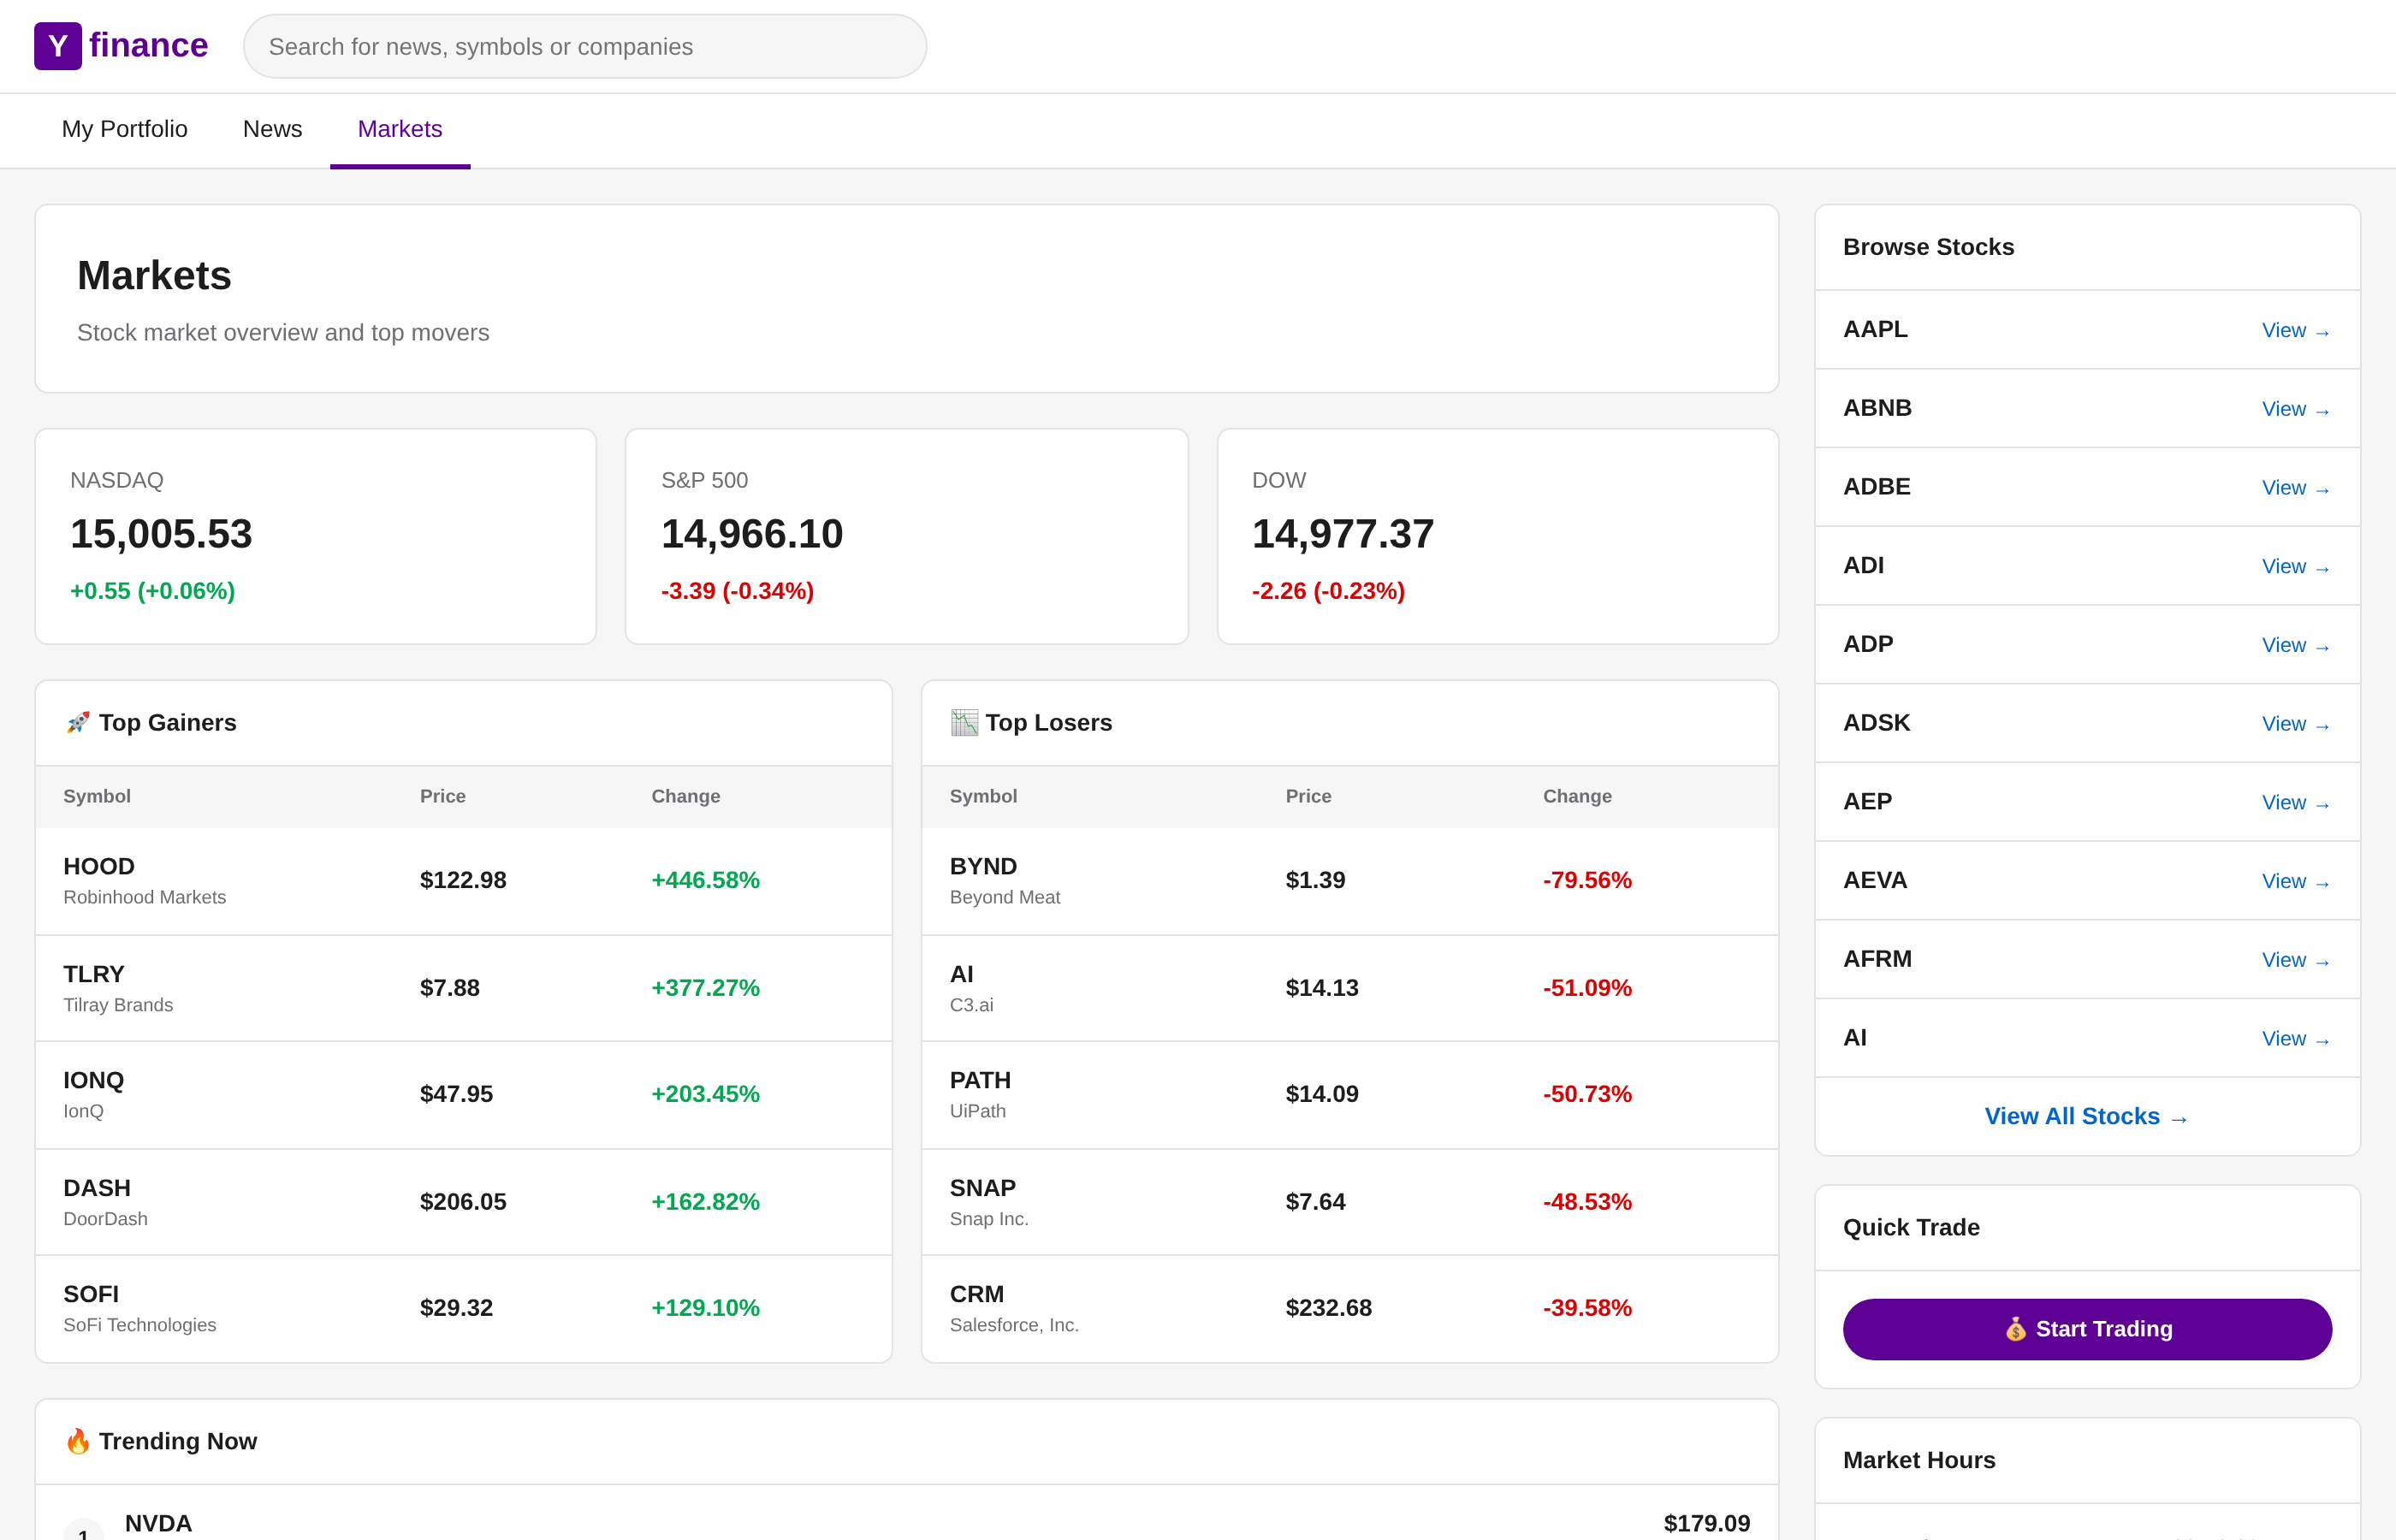
Markets overview
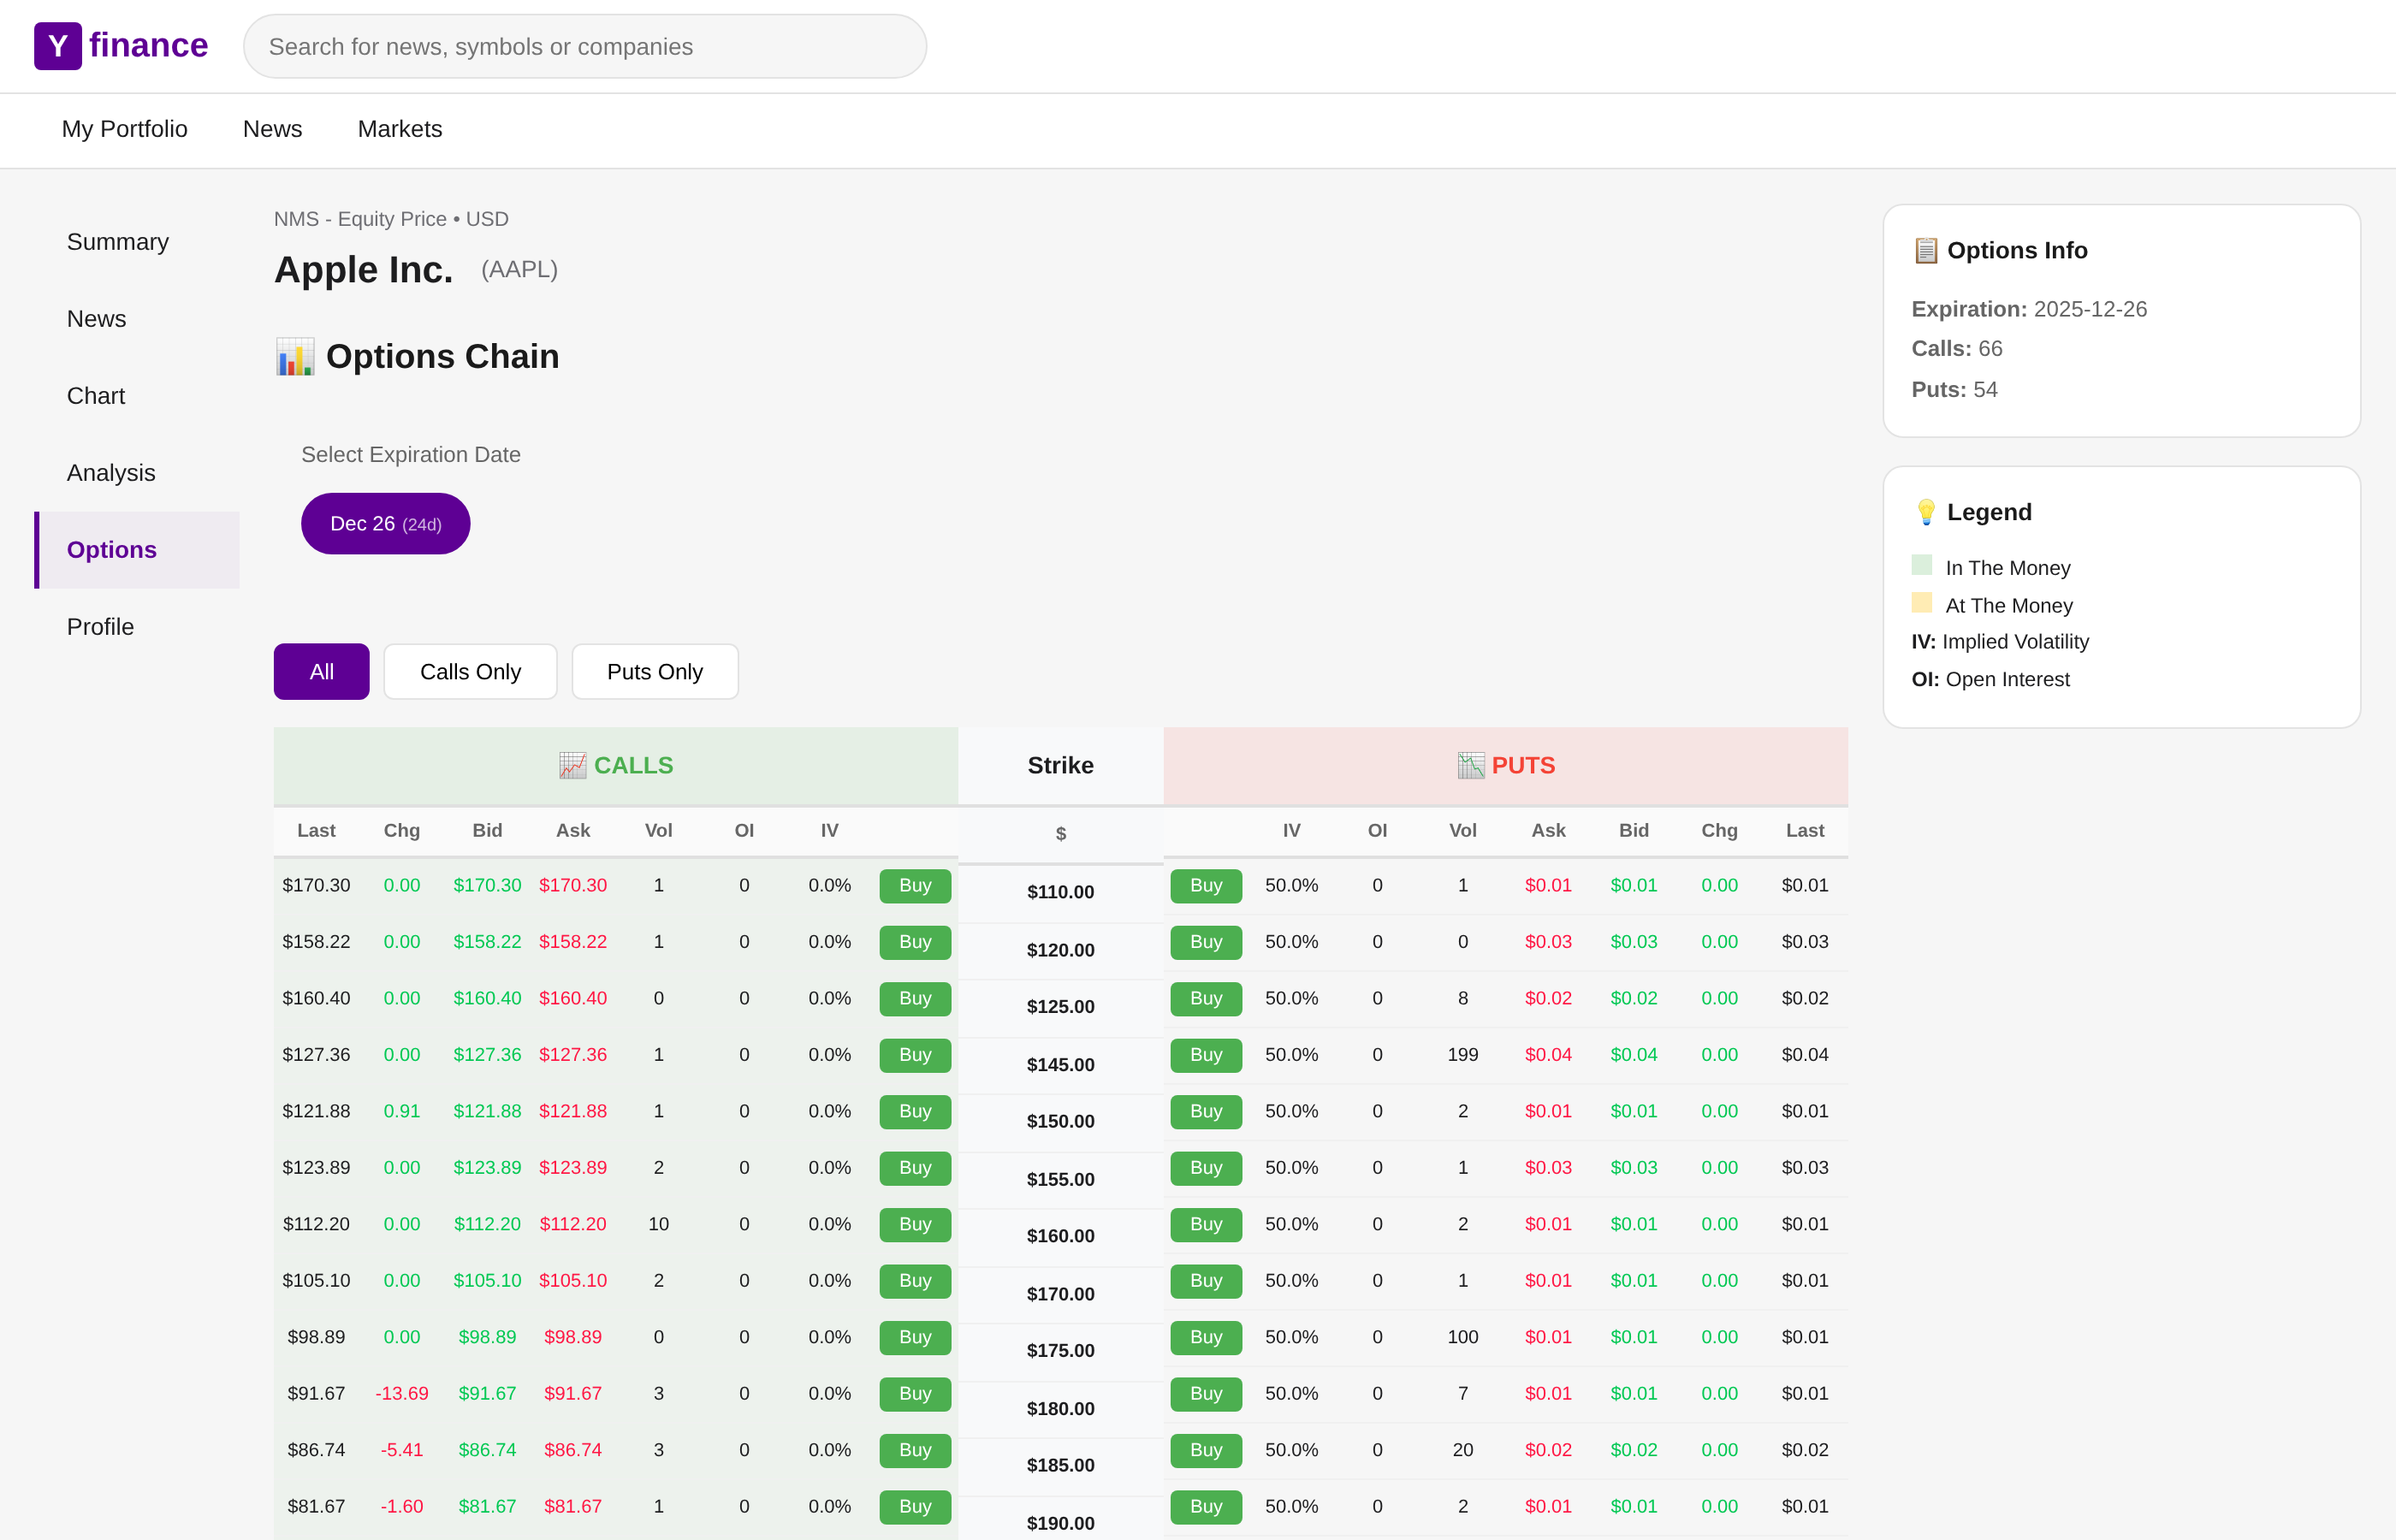
Options chain (AAPL)
Simulated Yahoo Finance brokerage platform used in the finance domain. The platform provides real-time stock quotes with integrated trading panels (a), multi-account portfolio management with holdings tracking (b), per-ticker news feeds (c) with full article browsing (d), a markets overview with indices, top movers, and trending stocks (e), and options chain data with calls/puts (f).