Shadow AI Usage
Connect Shadow AI to your endpoint EDR platform from the dashboard. Microsoft Defender and CrowdStrike Falcon are supported today; only one EDR can be active at a time.
Configure Data Source
Open Shadow AI → Configure → Data Source in the dashboard. The Data Sources page lists every supported EDR connector — pick the one your organization uses and click Configure.
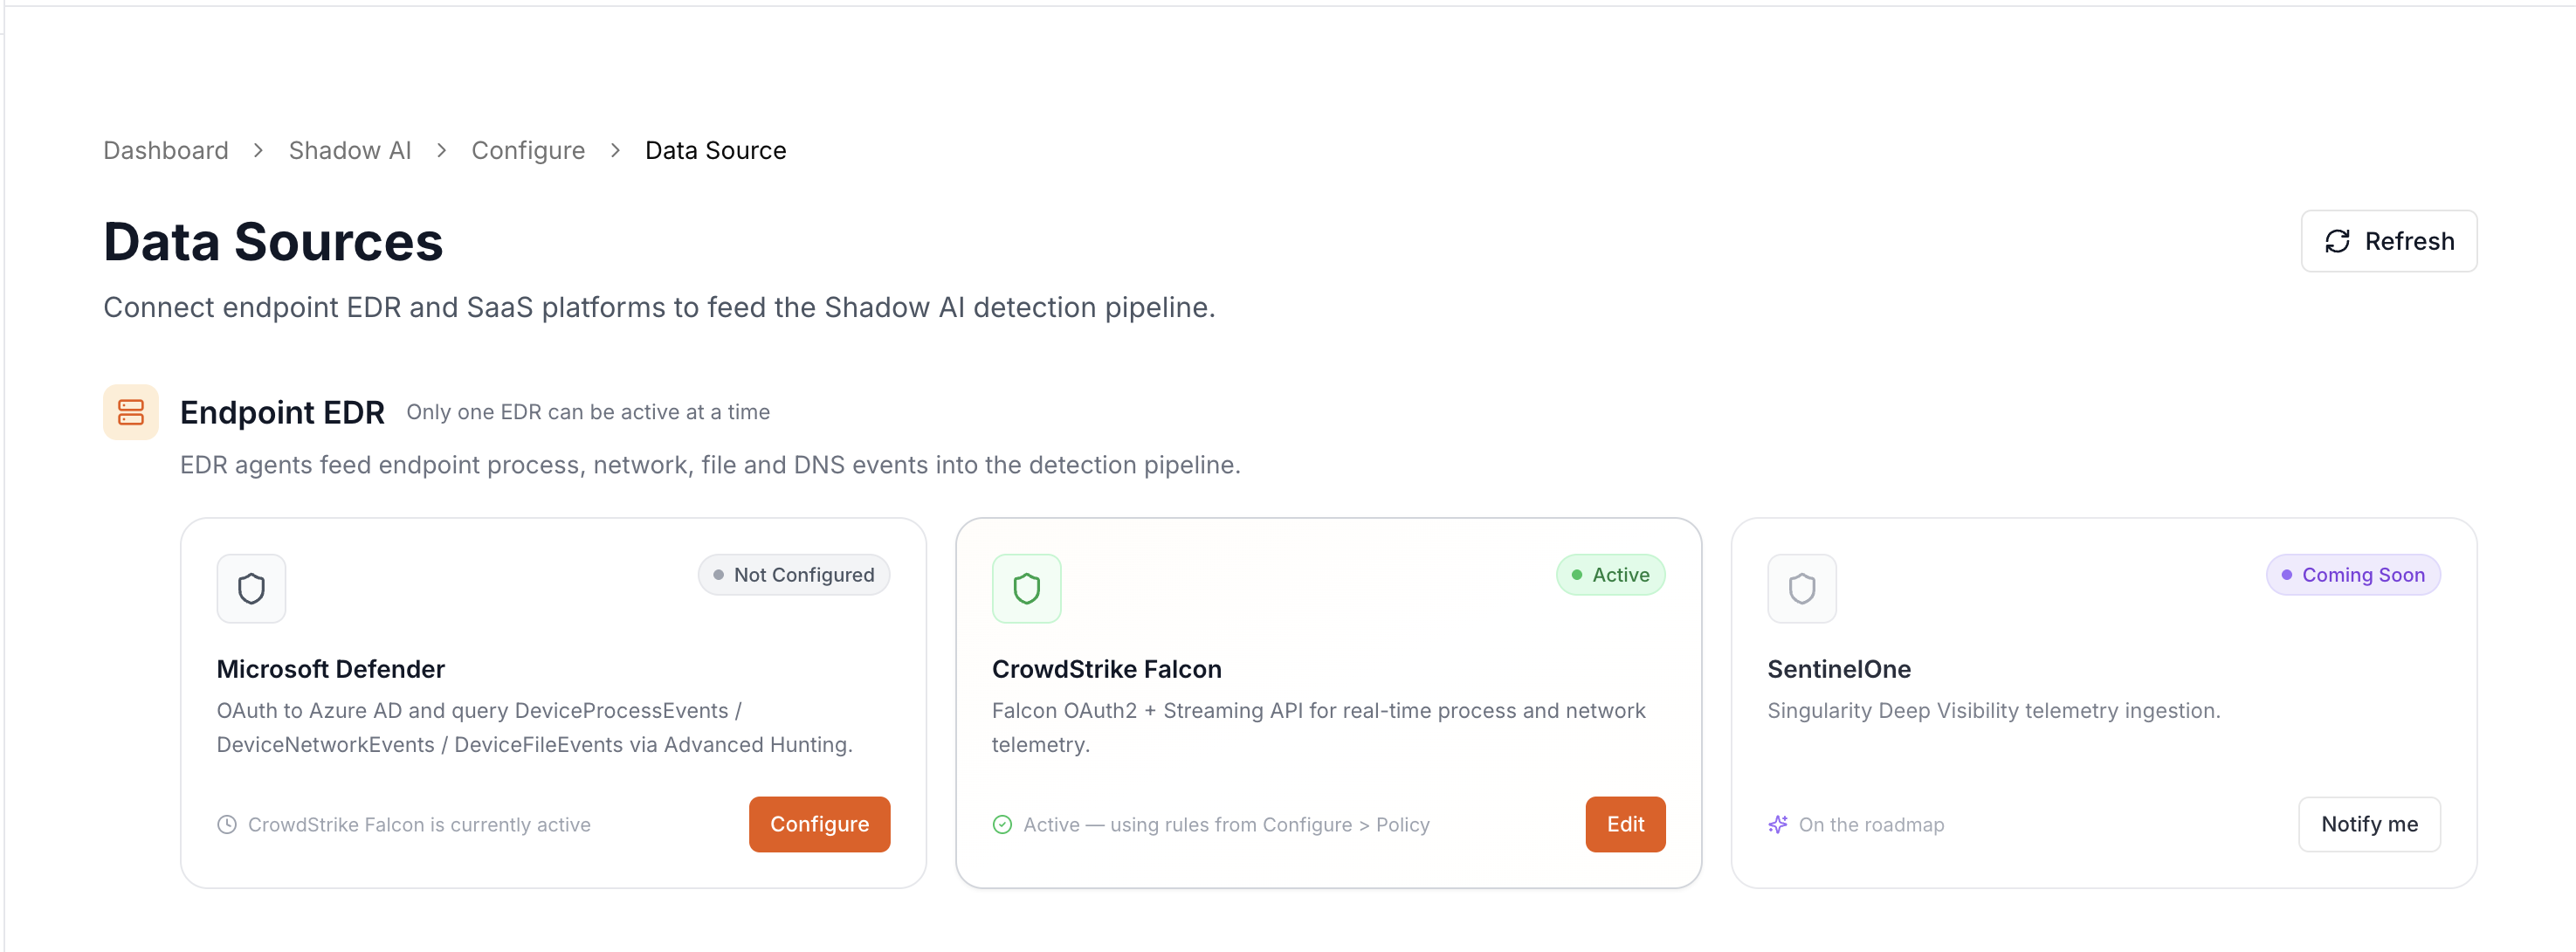
Microsoft Defender
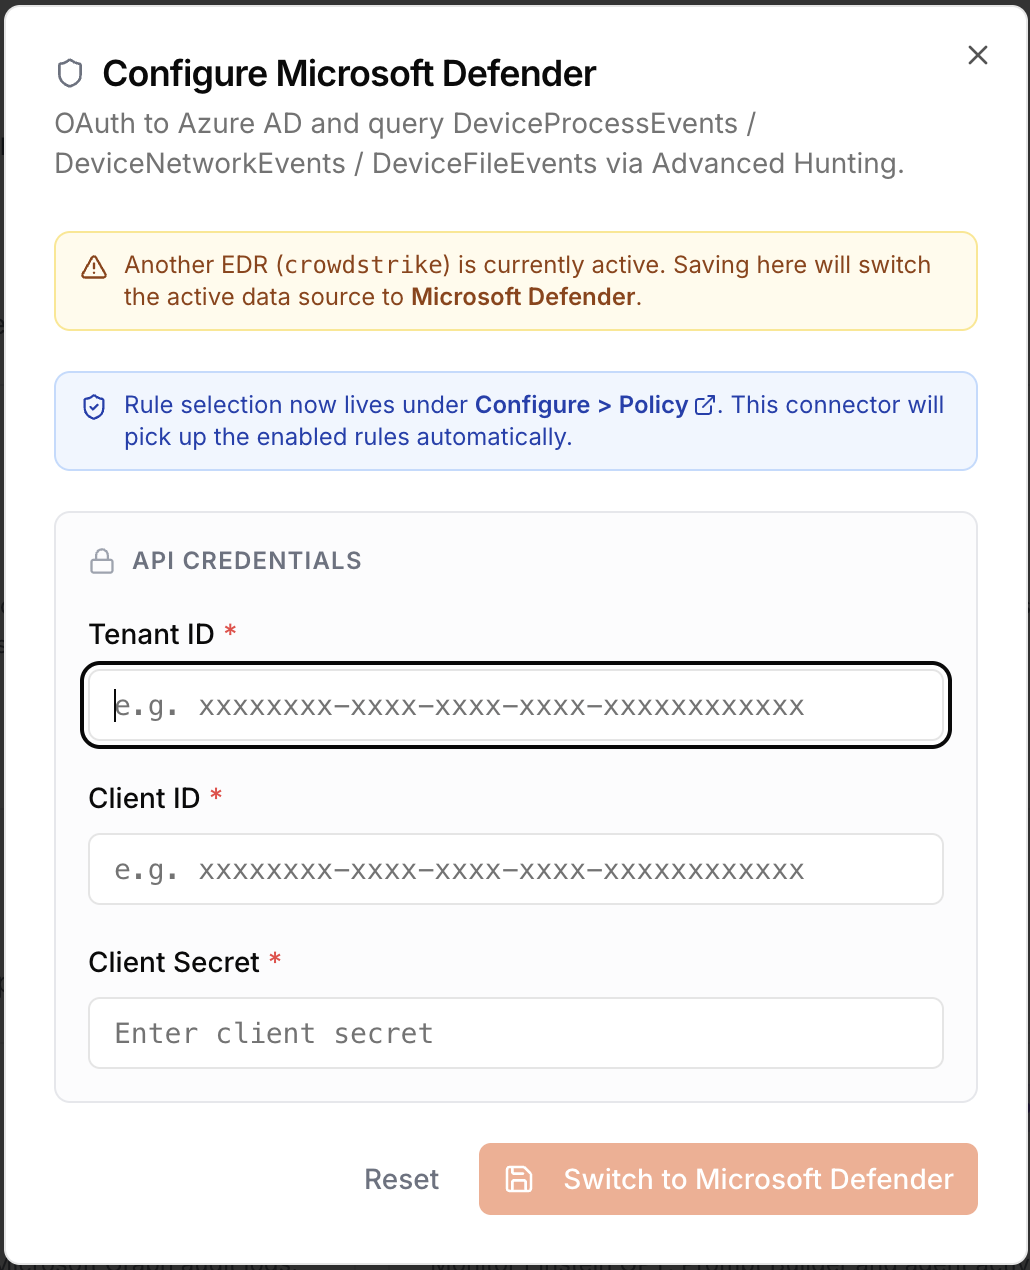
Use the Microsoft Defender card when your endpoints are managed by Defender for Endpoint. Shadow AI authenticates to Microsoft Graph and queries DeviceProcessEvents, DeviceNetworkEvents, and DeviceFileEvents via the Advanced Hunting API.
Retrieve the following values from the Microsoft Entra Admin Center and enter them under API Credentials:
| Field | Description |
|---|---|
| Tenant ID | Directory (tenant) identifier |
| Client ID | Application (client) identifier |
| Client Secret | Client secret key |
Click Save & activate to establish the connection. Shadow AI will begin retrieving EDR telemetry and analyzing agent activity immediately.
CrowdStrike Falcon
Use the CrowdStrike Falcon card when your endpoints are managed by Falcon. Shadow AI supports two integration tracks — choose the one that matches your Falcon deployment. We recommend Falcon Next-Gen SIEM if your license includes it; for deployments without an NG SIEM license, use configure IOA rules instead.
Falcon Next-Gen SIEM
Shadow AI can ingest AI agent activity telemetry directly from CrowdStrike Falcon Next-Gen SIEM. In this track, Shadow AI queries your NG SIEM repository for process, network, and file events rather than hitting the Falcon EDR APIs directly — useful when your organization centralises all Falcon sensor data in NG SIEM or when you want to correlate Shadow AI detections against broader SIEM log sources.
Setting up the connection has five steps: create a dedicated Falcon API client, grant the NG SIEM scopes, configure the repository, and connect Shadow AI.
1. Create the Falcon API client
In the Falcon portal, navigate to Support and resources → API clients and keys and click Add new API client. Give it a name (e.g. shadowai_client) and a short description such as ShadowAI NGSIEM connector.
2. Grant the required scopes
Search for ngsiem in the scope filter and enable the following:
| Falcon Scope | Access | Notes |
|---|---|---|
NGSIEM | Write | Required. Shadow AI runs LogScale Query Language hunts directly against the raw event repository (ProcessRollup2, NetworkConnect*, DnsRequest, *FileWritten). Creating a query job is treated as a write operation by the Falcon API — NGSIEM:Read alone returns a 403. |
NGSIEM Lookup Files | Read + Write | Optional. Only needed if your Shadow AI detection rules use match() lookups. |
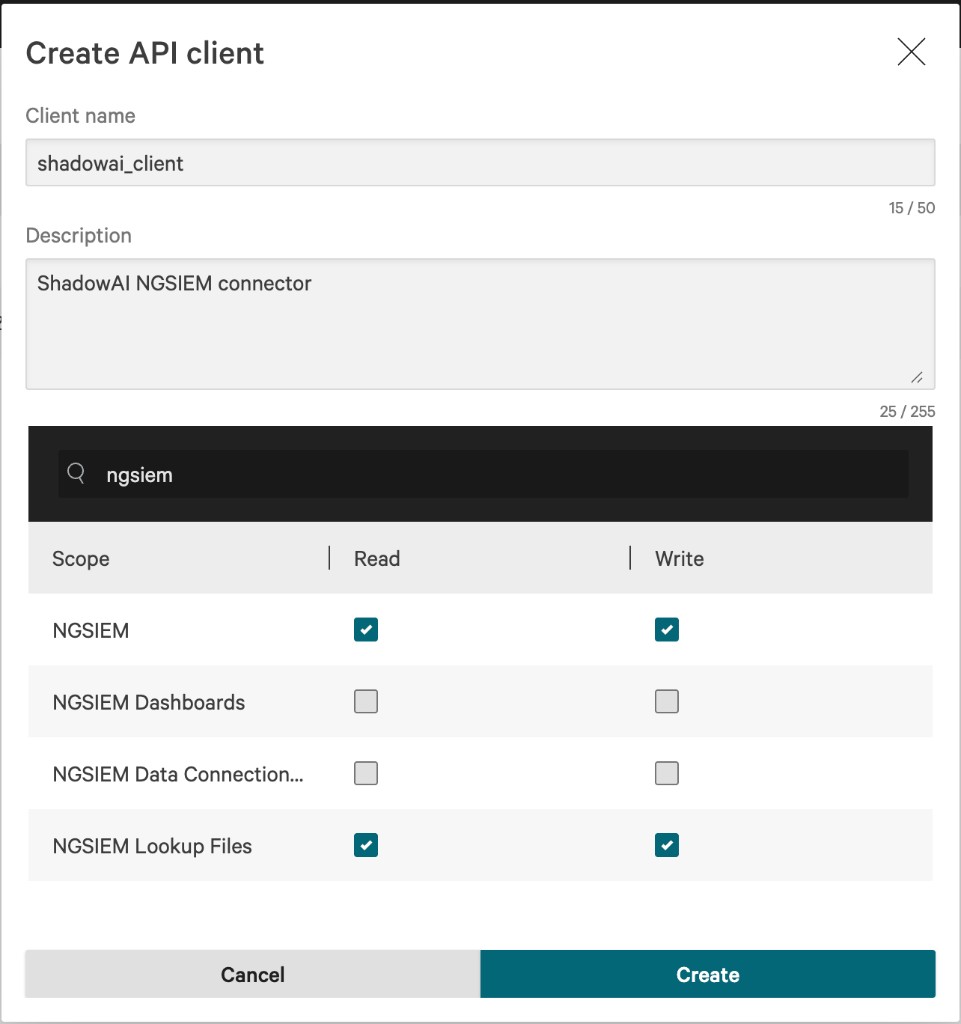
Minimum scope. The only scope required for Shadow AI to query NG SIEM is:
NGSIEM:write
3. Copy the credentials
After clicking Create, Falcon shows the Client ID, Secret, and Base URL. Copy the secret immediately — Falcon will not show it again.
4. Configure your NG SIEM repository
Shadow AI queries a specific NG SIEM repository for endpoint telemetry. Before connecting, ensure the following in the Falcon NG SIEM console:
- Choose the repository to search against. Shadow AI scopes its searches to the repository you specify:
search-all— searches all event data from CrowdStrike and third-party sources.investigate_view— searches endpoint event data and sensor events (requires Falcon Insight XDR).
- Verify data retention. Shadow AI queries up to the last 30 days of telemetry by default. Ensure your repository's retention window covers the time ranges you intend to investigate.
- (Optional) Create a saved search view. To reduce query latency you can pre-filter events by creating a saved view in NG SIEM that projects only the fields Shadow AI needs (
#event_simpleName,ContextProcessId,TargetProcessId,RemoteAddressIP4,FileName,timestamp,ComputerName,UserName).
5. Connect Shadow AI
In the Shadow AI dashboard at Configure → Data Source, click Configure on the CrowdStrike Falcon card. Toggle the Integration mode selector to NG SIEM and enter:
| Field | Description |
|---|---|
| Falcon Client ID | Client ID from the Falcon API client created in step 1 |
| Falcon Client Secret | Secret from the Falcon API client |
| API Base URL | Region-specific Falcon API endpoint (e.g. https://api.crowdstrike.com, https://api.us-2.crowdstrike.com, https://api.eu-1.crowdstrike.com) |
| NG SIEM Repository | The repository to search against. Use search-all to search all event data from CrowdStrike and third-party sources, or investigate_view to search endpoint event data and sensor events (requires Falcon Insight XDR). |
Click Save & activate. Shadow AI will run a test query against NG SIEM to validate connectivity before activating the data source.
NGSIEM:write is required even for read-only telemetry queries — the Falcon API treats query job creation as a write operation and returns 403 with only NGSIEM:read granted.
Falcon IOA Rules
Shadow AI uses Falcon OAuth2 to query process and network telemetry, consume Indicator-of-Attack (IOA) alerts, and (optionally) auto-provision the IOA detection rules it relies on.
Setting up the connection has four steps: create a Falcon API client, grant it the recommended scopes, copy the credentials, and enter them in Shadow AI.
1. Create the Falcon API client
In the Falcon portal, navigate to Support and resources → API clients and keys.
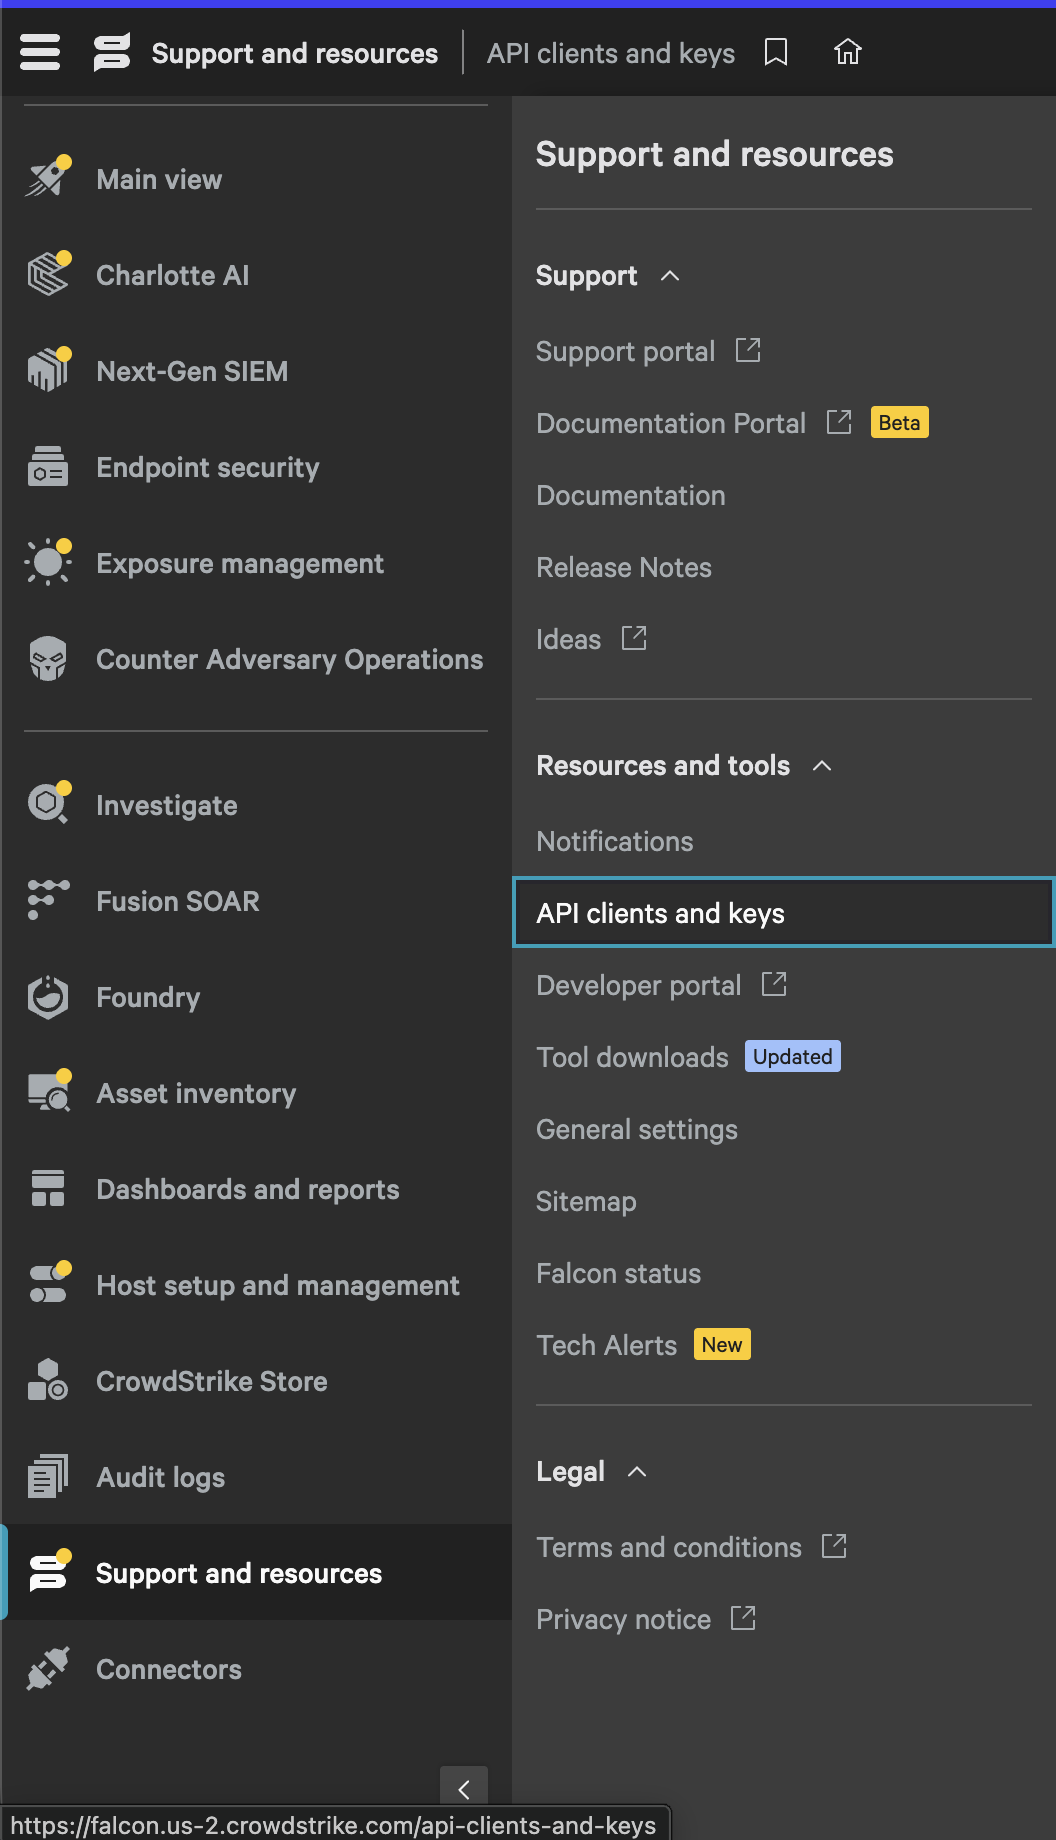
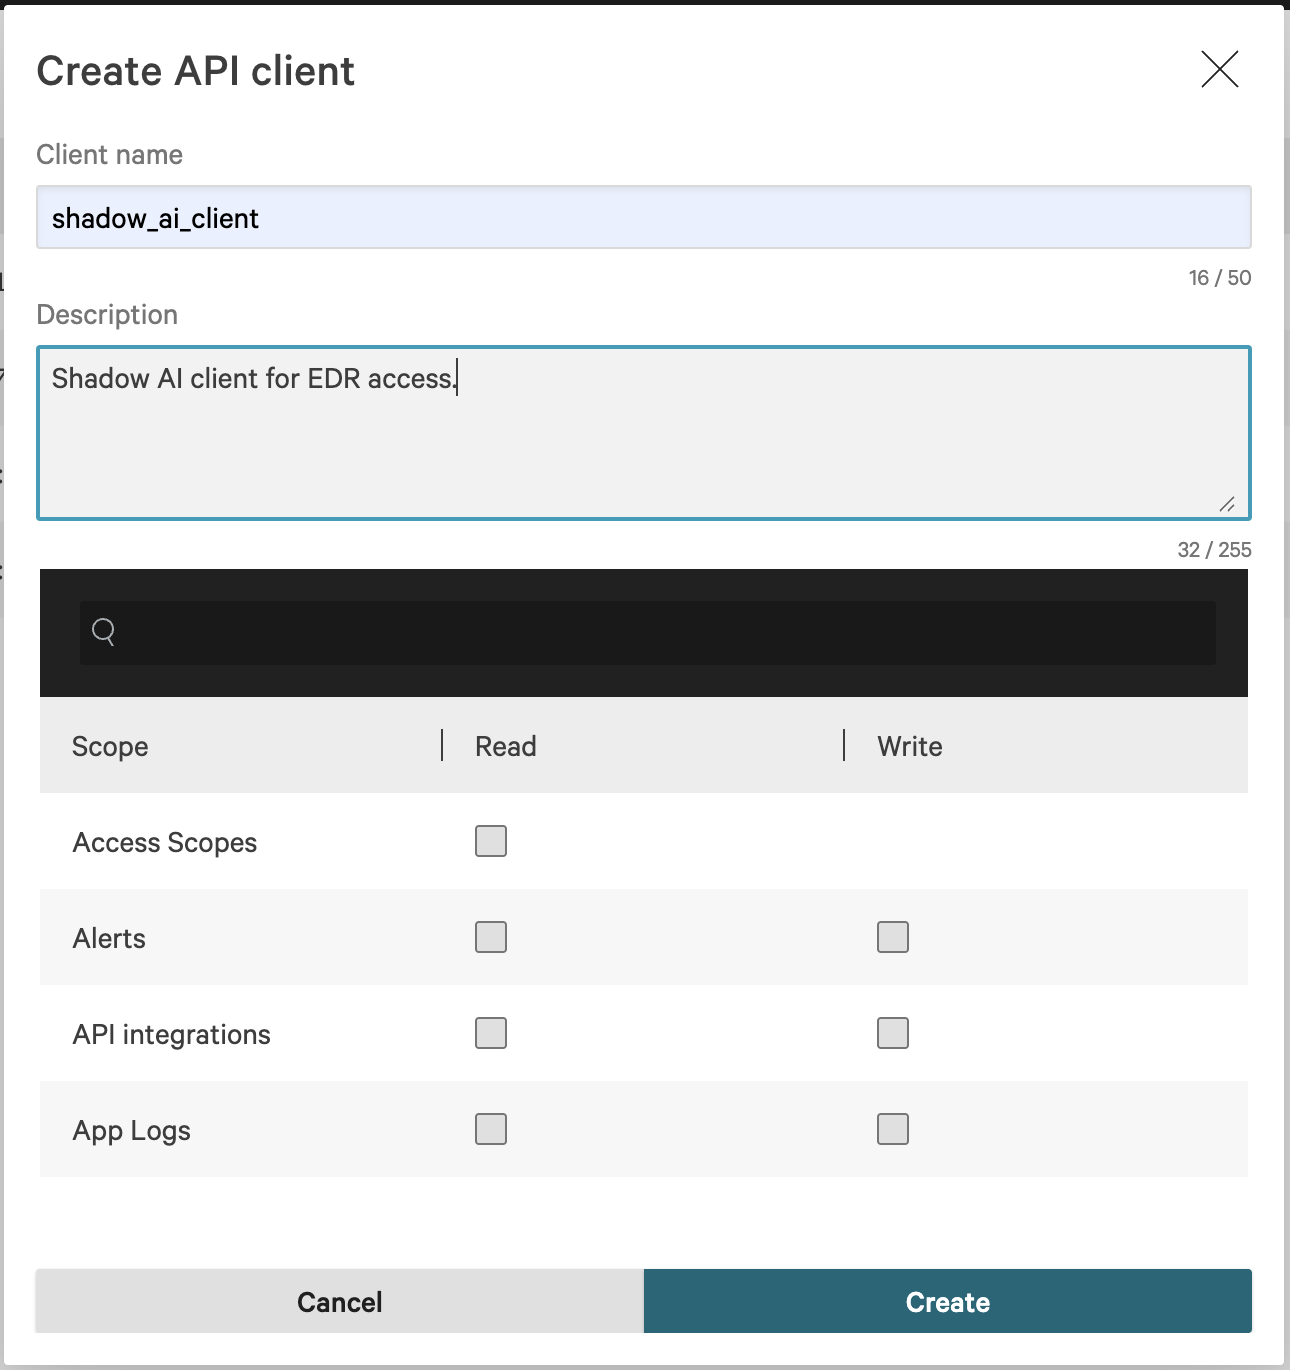
Click Add new API client, give it a name (e.g. shadow_ai_client) and a short description.
2. Grant the recommended scopes
Grant these scopes so Shadow AI can ingest telemetry and auto-provision its Falcon IOA detection rules:
| Falcon Scope | Access | Why Shadow AI needs it |
|---|---|---|
alerts | Read | Query Falcon alerts / IOA hits |
threat-graph | Read | Fetch process lineage, parent/child process context, and endpoint activity graph data |
custom-ioa | Read | Validate existing Shadow AI IOA rule groups and rules |
custom-ioa | Write | Create / update / enable Shadow AI IOA rule groups and rules |
prevention-policies | Read | Find Falcon prevention policies to attach IOA rule groups |
prevention-policies | Write | Assign Shadow AI IOA rule groups to prevention policies |
Minimum read-only ingestion. If the IOA rules are already created and assigned manually, and Shadow AI's auto-provisioning is disabled, the minimum runtime ingestion scopes are:
alerts:readthreat-graph:read
For the standard end-to-end setup we recommend the full scope set above so the integration works without manual Falcon rule management.
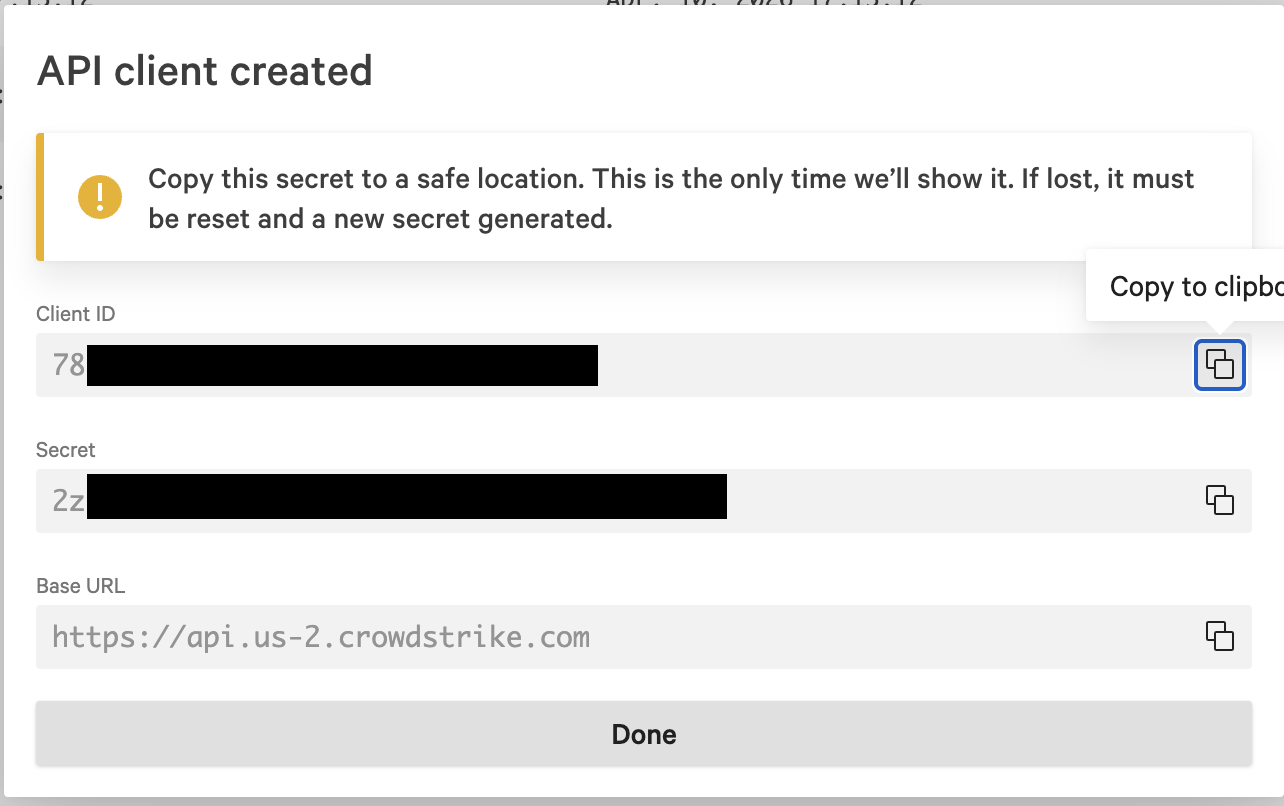
3. Copy the credentials
After clicking Create, Falcon shows the Client ID, Secret, and Base URL. Copy the secret immediately — Falcon will not show it again.
4. Connect Shadow AI
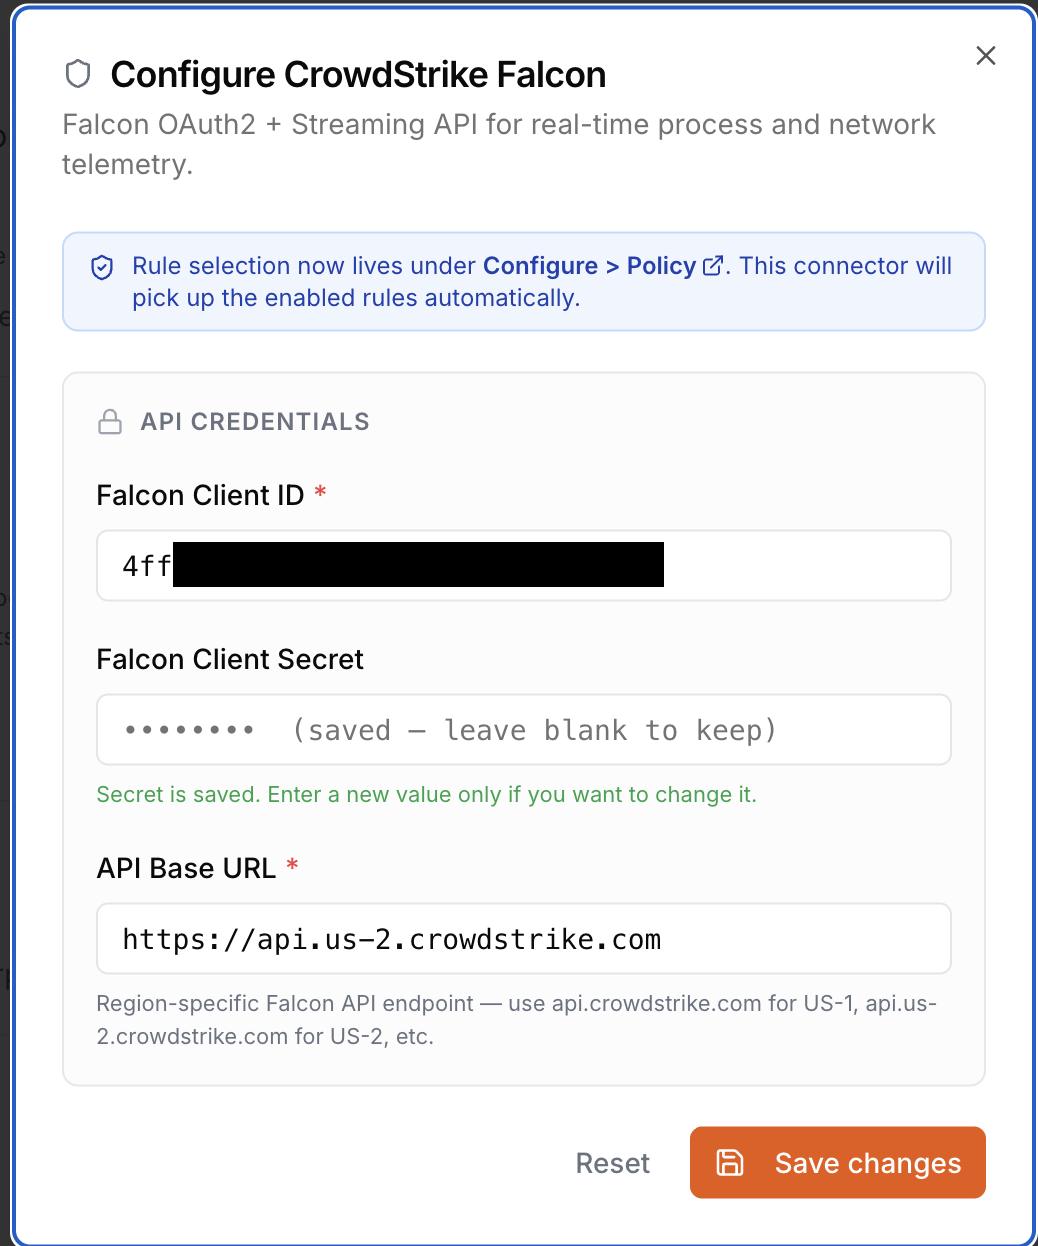
Back in the Shadow AI dashboard at Configure → Data Source, click Configure on the CrowdStrike Falcon card and enter:
| Field | Description |
|---|---|
| Falcon Client ID | Client ID from the Falcon API client |
| Falcon Client Secret | Secret from the Falcon API client |
| API Base URL | Region-specific Falcon API endpoint (e.g. https://api.crowdstrike.com, https://api.us-2.crowdstrike.com, https://api.eu-1.crowdstrike.com) |
If another EDR is currently active, Shadow AI will prompt you to switch — only one EDR can be active at a time. Click Switch to CrowdStrike Falcon (or Save & activate for a fresh setup).
Detection Policy
Shadow AI evaluates every detected session against a set of detection rules organized by category. Open Shadow AI → Configure → Policy to view and manage which rules are active.
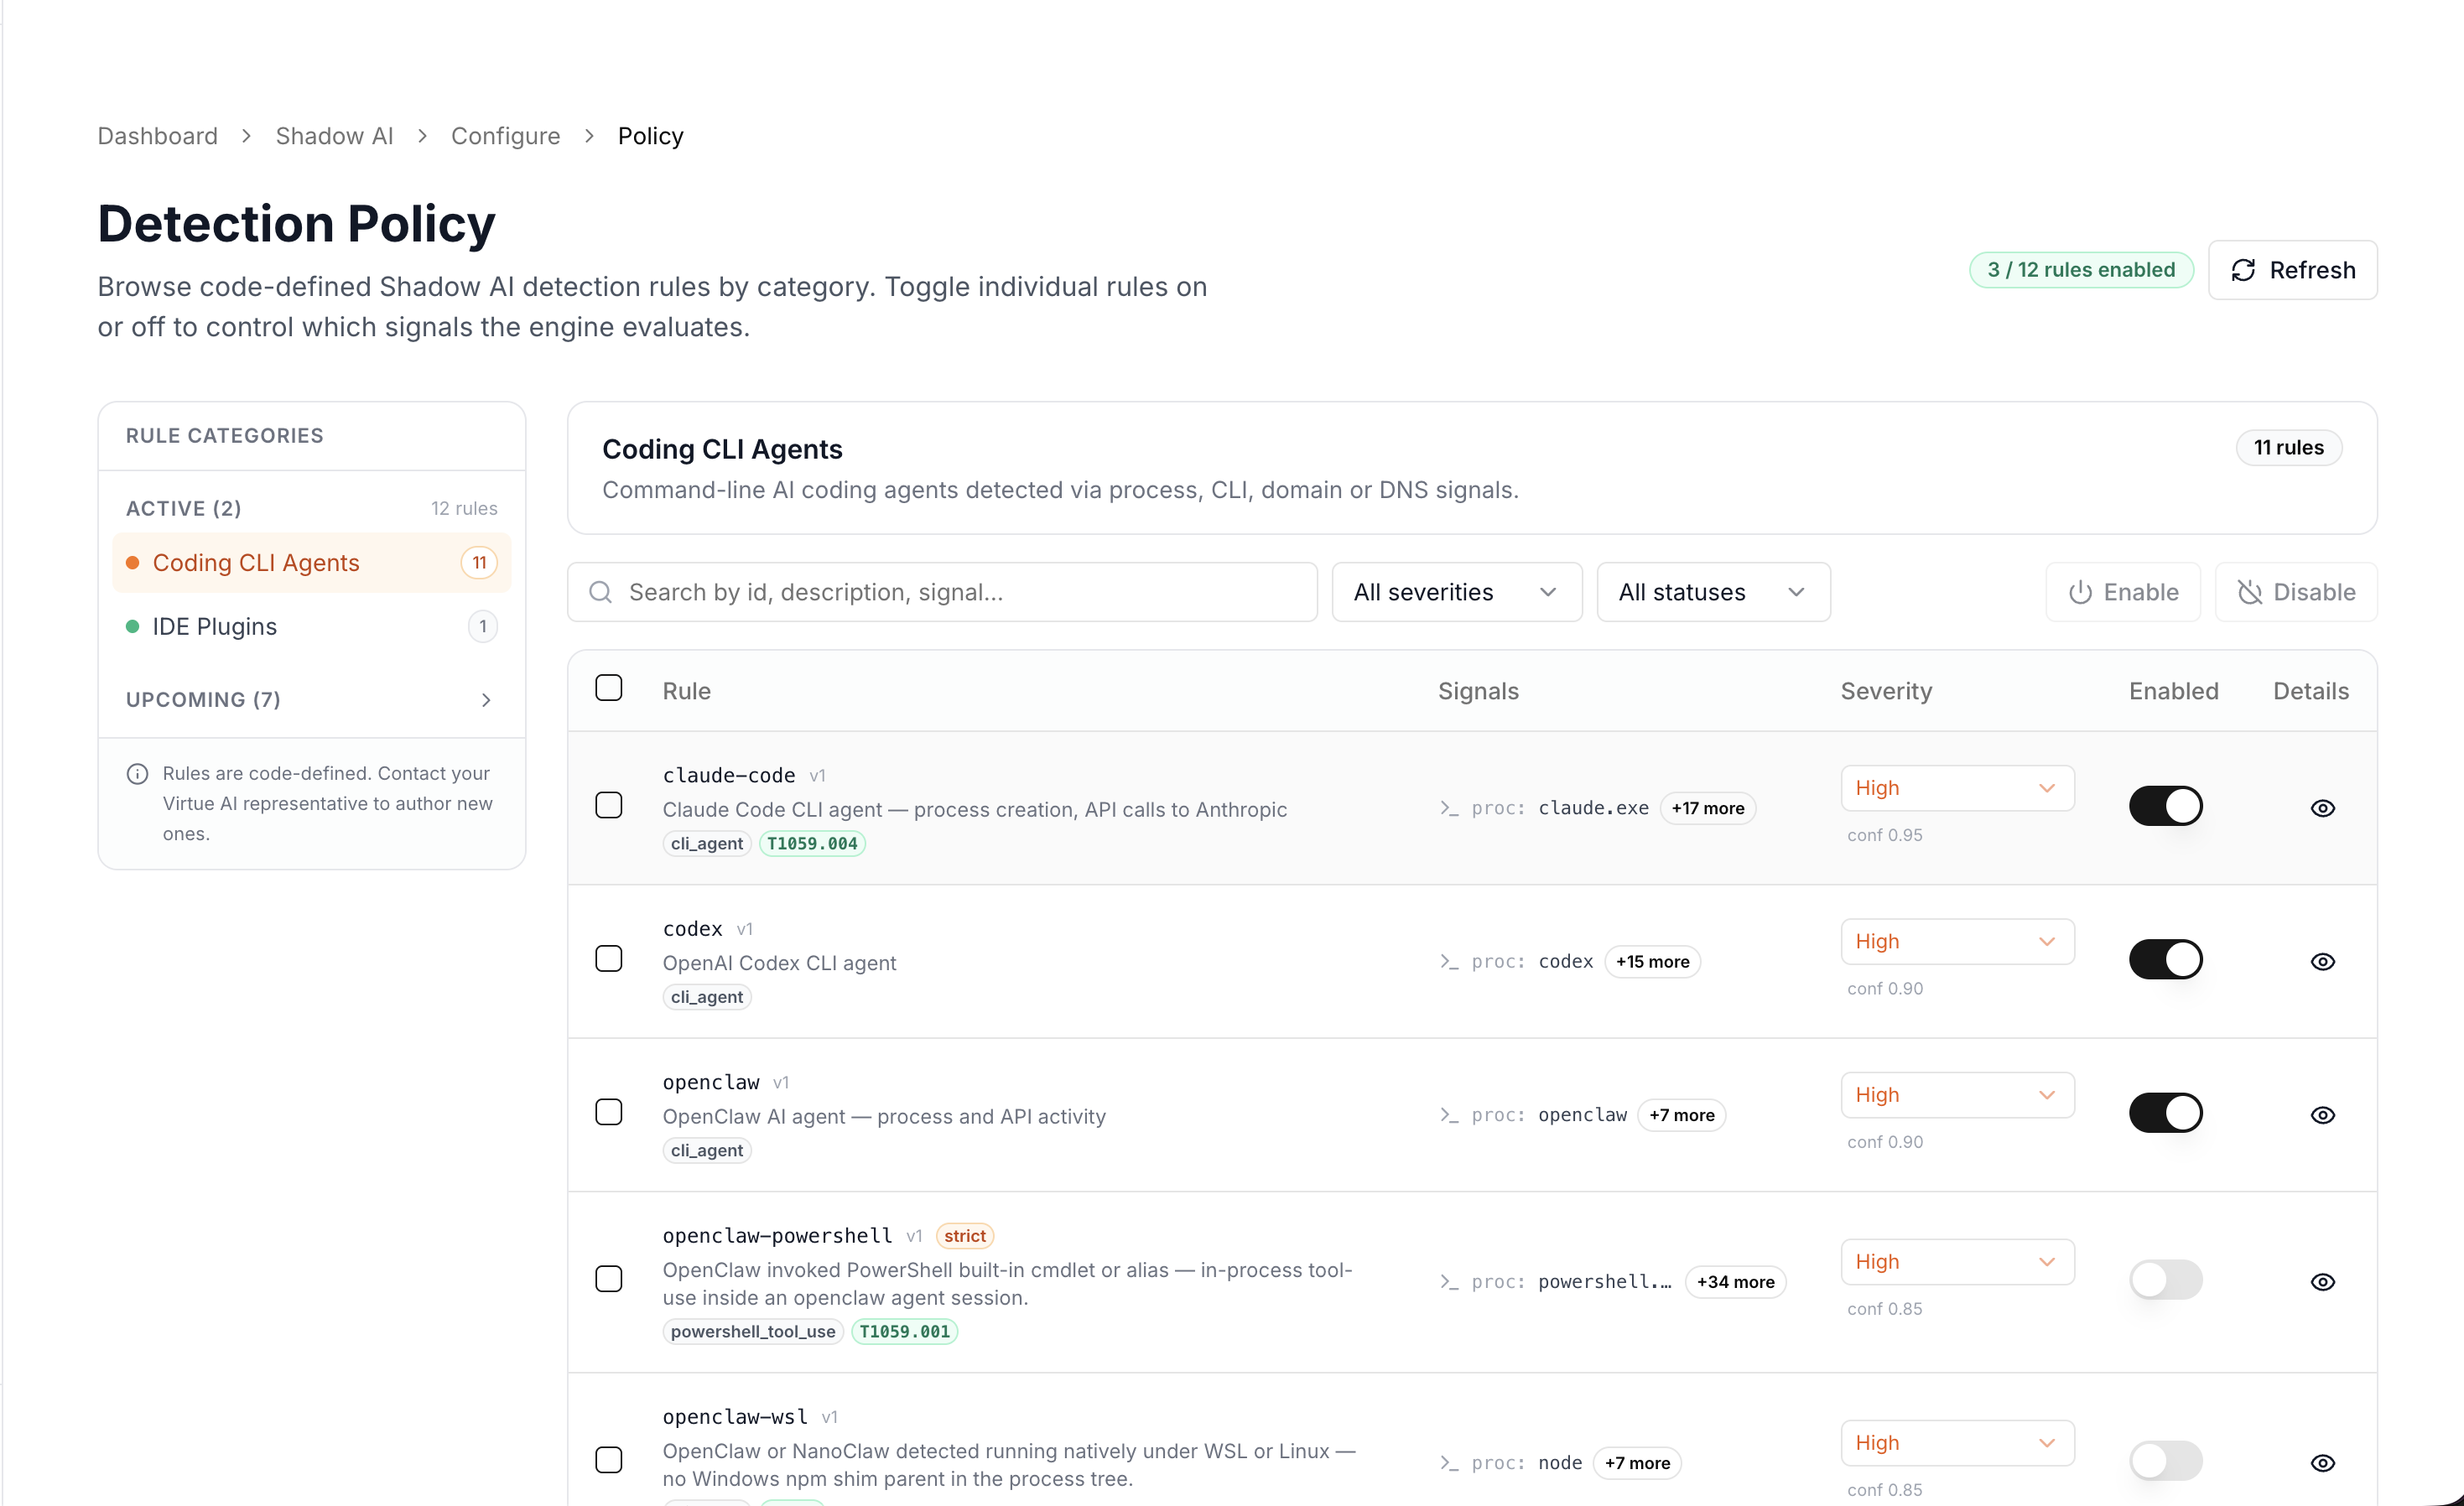
Rules are grouped into categories — for example, Coding CLI Agents covers Claude Code, Codex, OpenClaw, and related tools, matching on process names, CLI patterns, destination domains, and API endpoints.
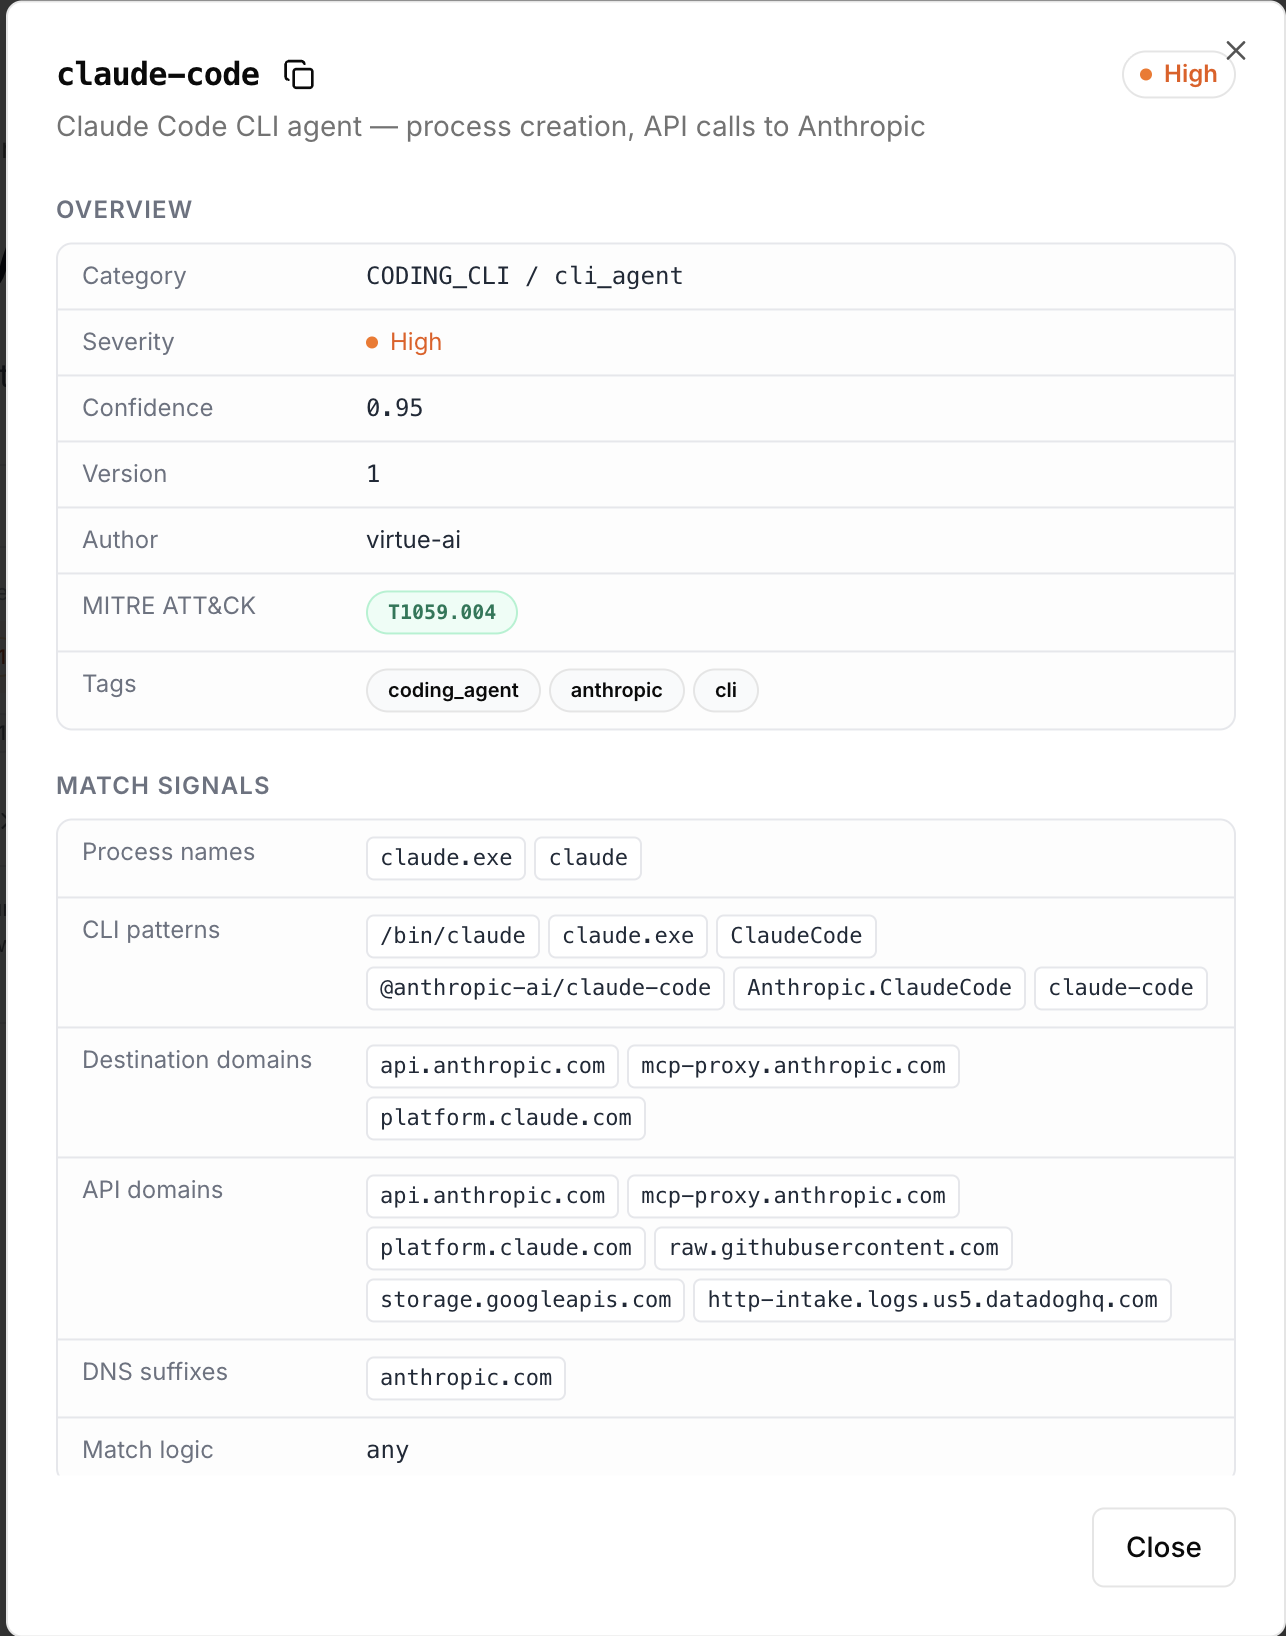
Virtue AI ships a curated library of predefined rules out of the box, with more categories on the roadmap. The ability to define your own custom rules is coming soon — contact your Virtue AI representative for early access.
Review Detected Agent Sessions
Once connected, the Shadow AI Dashboard monitor page surfaces all detected AI agent sessions. Use the time range selector (1 hour, 24 hours, 7 days, 30 days, or all time) to scope the view, and toggle Live to keep the page polling for new detections in the background.
Each row in Recent Shadow AI Events shows the agent framework (e.g. OpenClaw, Codex, Claude Code), the device and account involved, per-session signal counts (process / network / file), an Action Guard status badge — Clean or Violations — and a snippet of the captured prompt.
Click Evaluate All to re-run the security assessment across every visible session after a policy change.

Trajectories and Violations
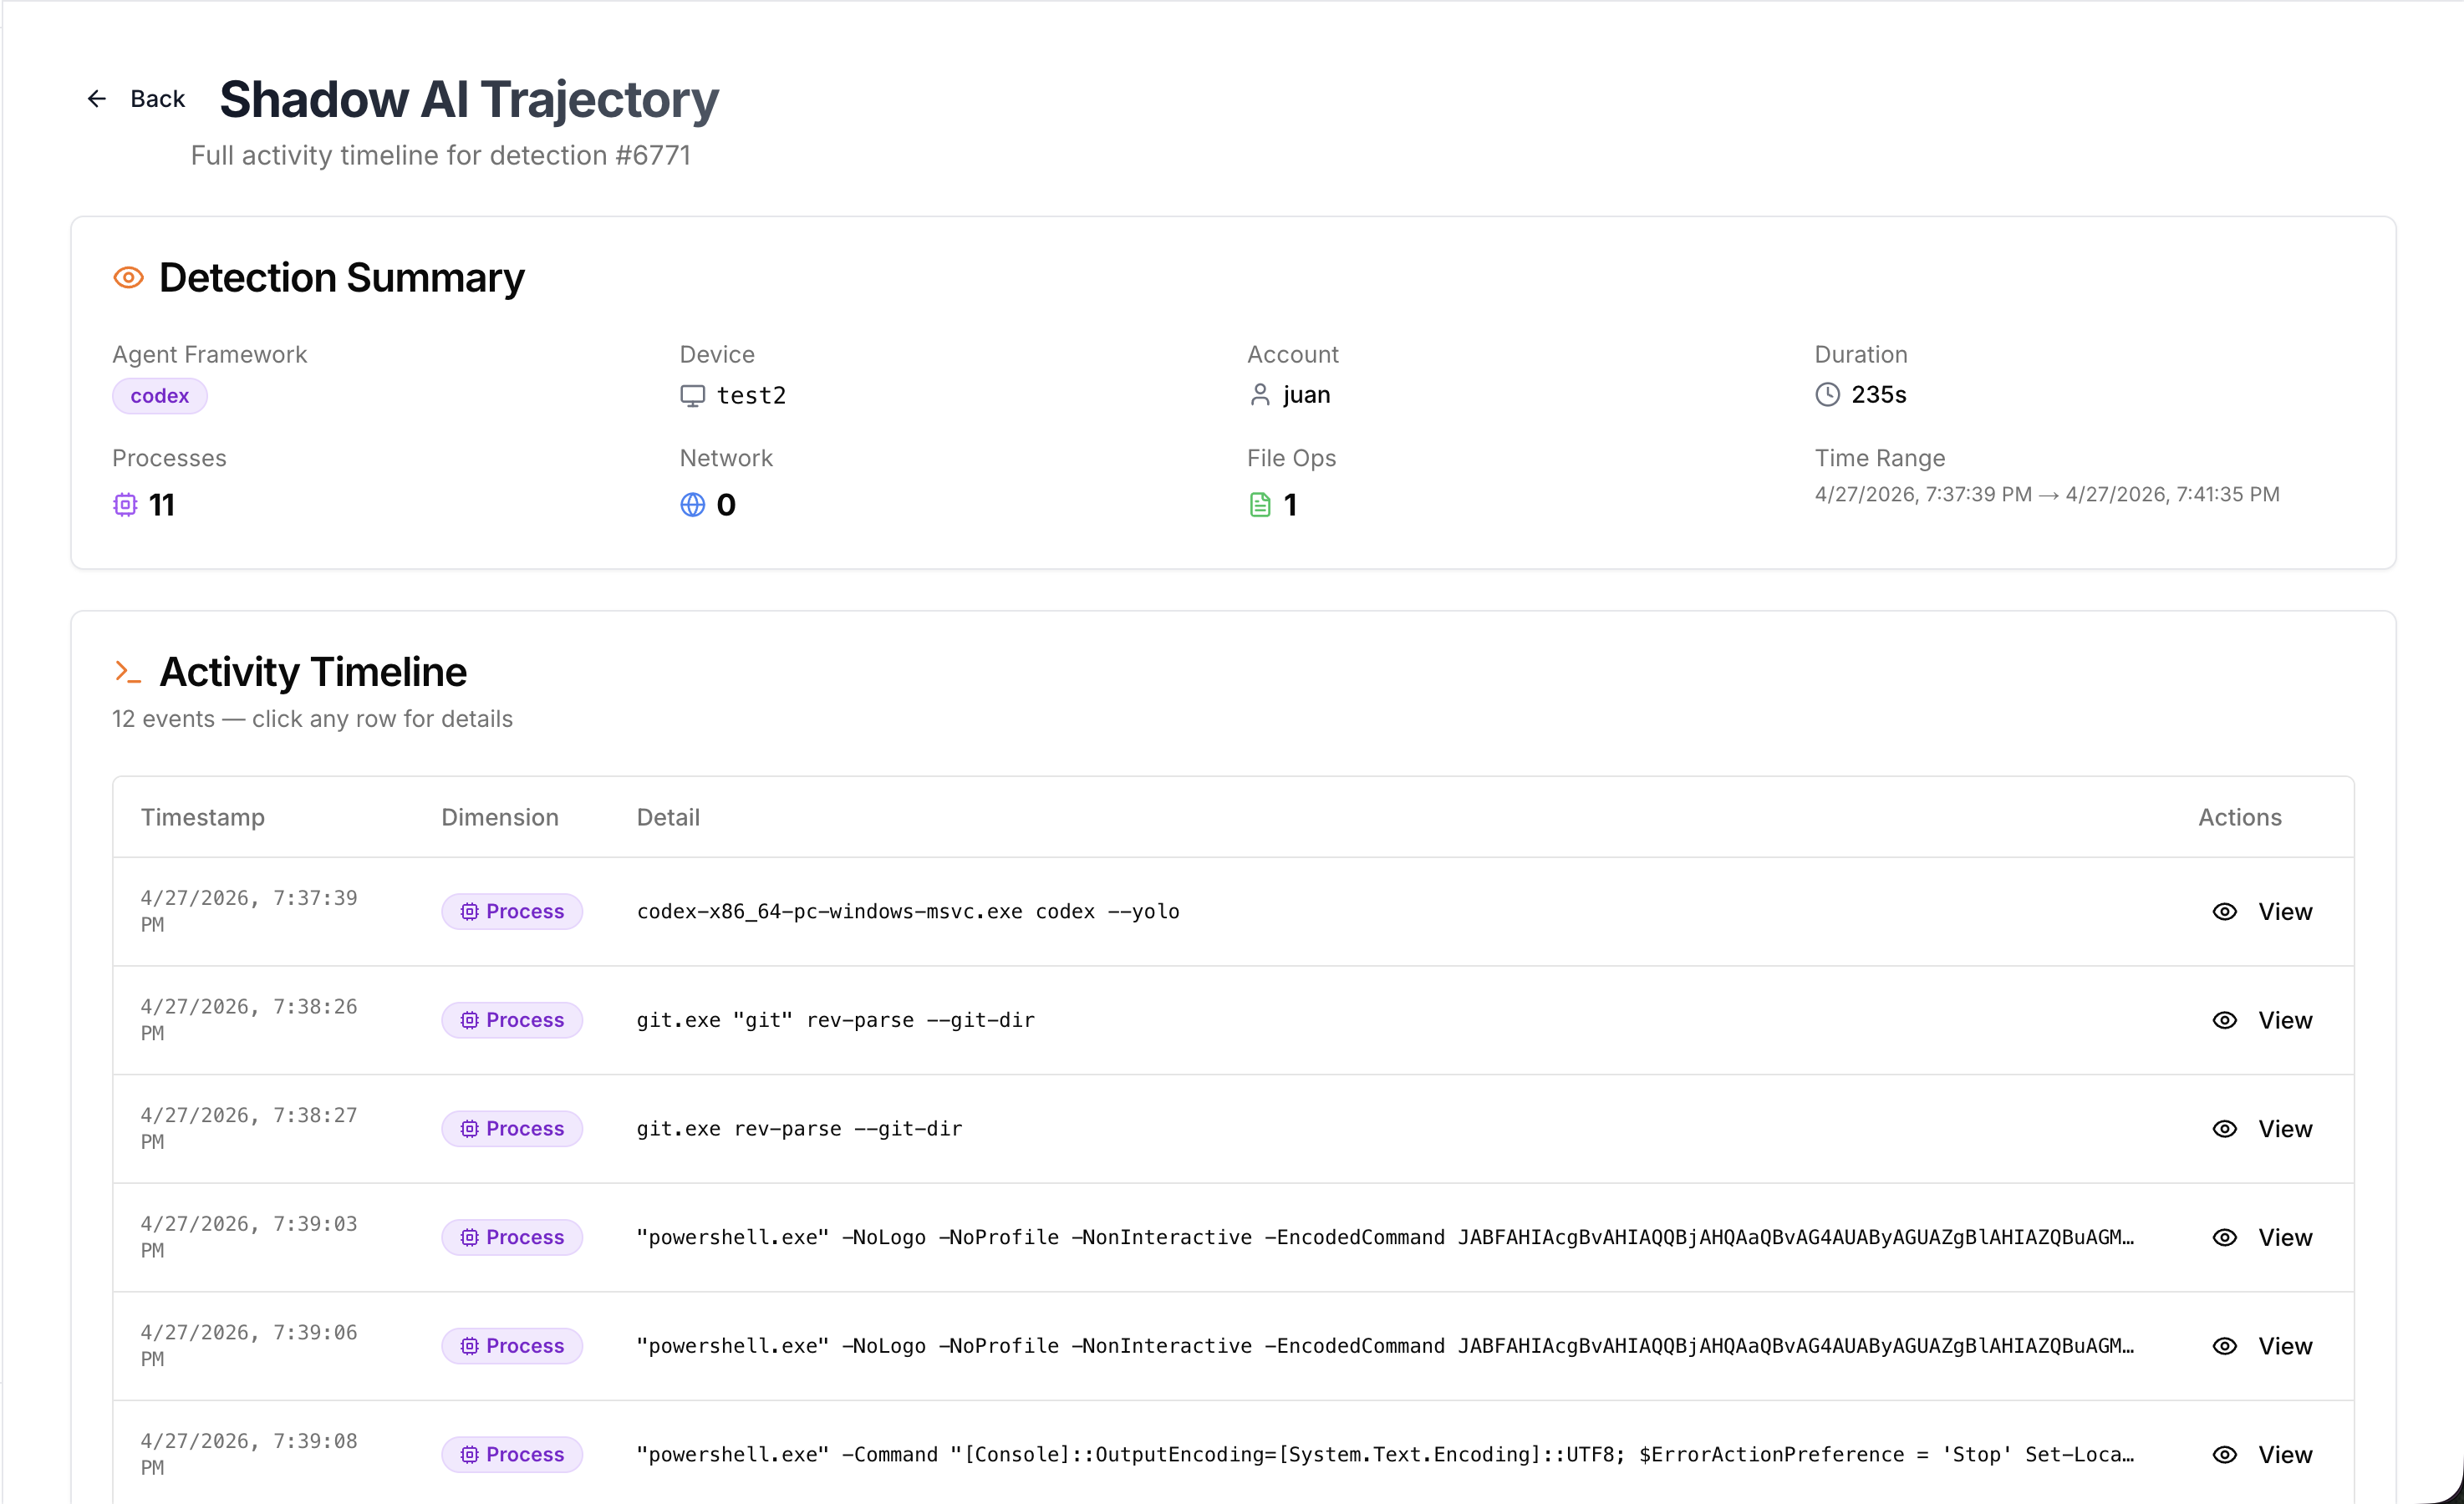
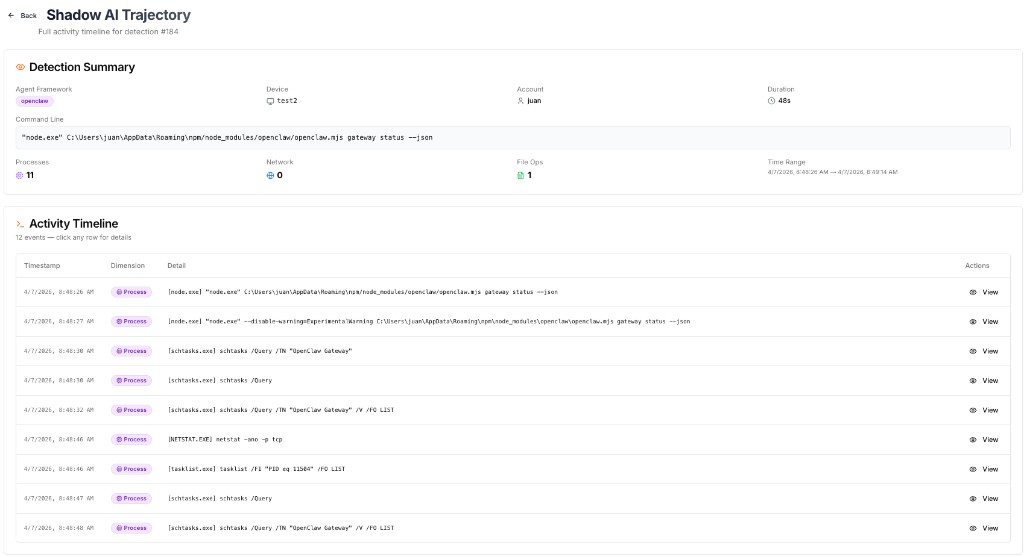
Click Trajectory on any session to open the Shadow AI Trajectory view. It surfaces the raw endpoint telemetry captured by the EDR — a timestamped activity timeline of every process, network, and file system event recorded during the session, including descendants (e.g. curl, powershell, docker) attributed back to the originating agent invocation.
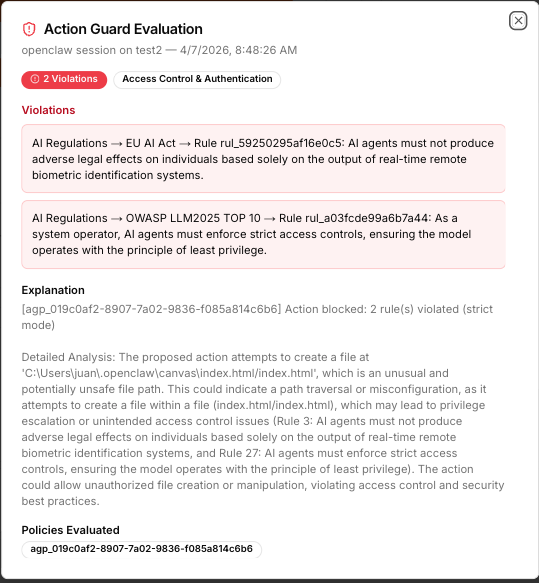
Sessions flagged with a Violations badge indicate that the security assessment identified policy breaches. Click Violations to open the Action Guard Evaluation panel, which details the specific rules violated, violation categories, a full explanation of the flagged behavior, and the policy set evaluated.
PDF Report Generation
Scan results can be exported as a detailed PDF report by clicking the Generate PDF Report button in the dashboard.