Connection and Configuration
Connect Shadow AI to your EDR framework and configure monitoring targets from the dashboard.
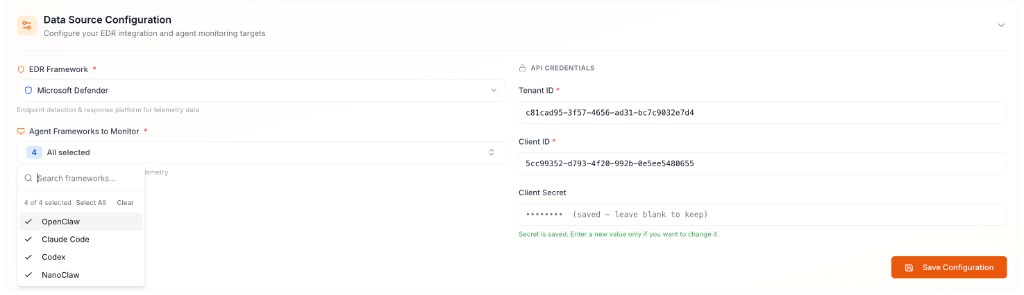
Configure Data Source
In the Data Source Configuration panel, specify your EDR integration, the agent frameworks to monitor, and your API credentials.
EDR Framework — Select Microsoft Defender as the endpoint detection and response platform for telemetry collection.
Agent Frameworks to Monitor — Select one or more AI agent applications to track (e.g. OpenClaw, Claude Code, Codex, NanoClaw). Use Select All to monitor all available frameworks.
API Credentials — Retrieve the following values from the Microsoft Entra Admin Center and enter them under API Credentials:
| Field | Description |
|---|---|
| Tenant ID | Directory (tenant) identifier |
| Client ID | Application (client) identifier |
| Client Secret | Client secret key |
Click Save Configuration to establish the connection. Shadow AI will begin retrieving EDR telemetry and analyzing agent activity immediately.
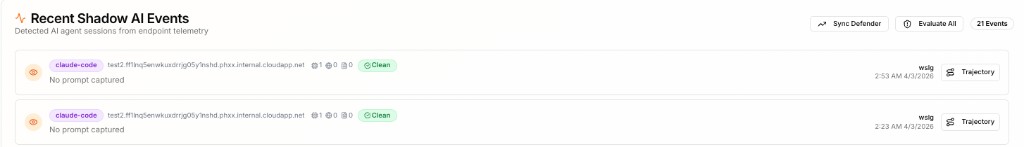
Review Detected Agent Sessions
Once connected, the Recent Shadow AI Events panel surfaces all detected AI agent sessions collected from endpoint telemetry. Each entry displays the agent framework and an overall risk status — Clean or Violations.
Use Sync Defender to pull the latest telemetry on demand, or Evaluate All to run a security assessment across all listed sessions.
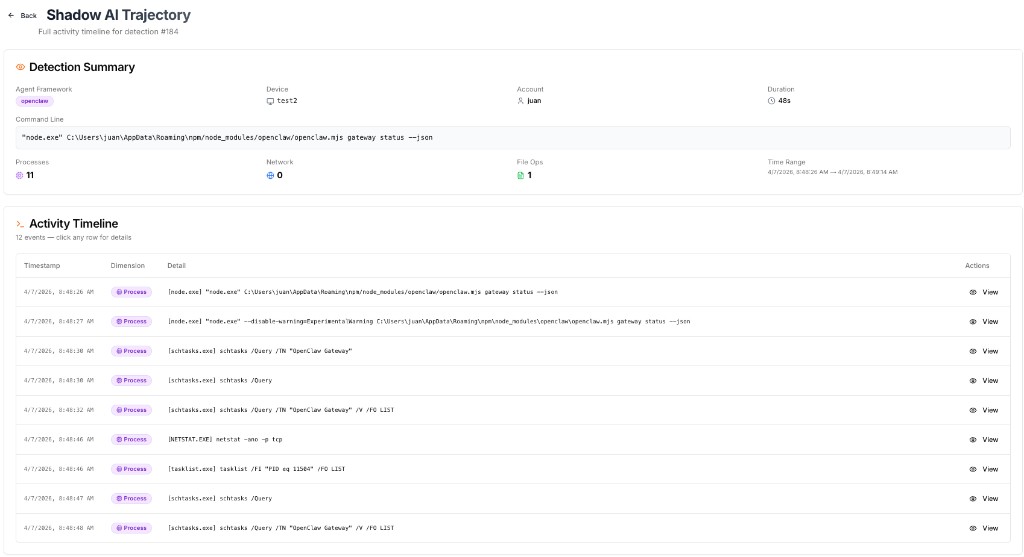
Trajectories and Violations
Click Trajectory on any session to open the Shadow AI Trajectory view, which surfaces the raw endpoint telemetry captured by the EDR — including a timestamped activity timeline of every process, network, and file system event recorded during that session.
![]()
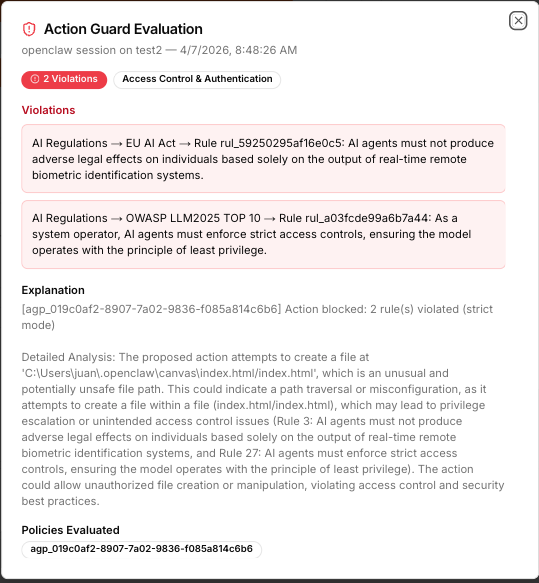
Sessions flagged with a Violations badge indicate that the security assessment identified policy breaches. Click Violations to open the Action Guard Evaluation panel, which details the specific rules violated, violation categories, a full explanation of the flagged behavior, and the policy set evaluated.